气候变化研究进展 ›› 2023, Vol. 19 ›› Issue (3): 347-356.doi: 10.12006/j.issn.1673-1719.2022.183
我国交通运输行业及不同运输方式的碳排放水平和强度分析
田佩宁1,2( ), 毛保华1,2(), 童瑞咏1,2, 张皓翔3, 周琪1,2
- 1 北京交通大学中国综合交通研究中心,北京 100044
2 北京交通大学综合交通运输大数据应用技术交通运输行业重点实验室,北京 100044
3 北京城建设计发展集团股份有限公司,北京 100037
-
收稿日期:2022-08-01修回日期:2022-10-22出版日期:2023-05-30发布日期:2023-02-13 -
通讯作者:毛保华,男,教授,bhmao@bjtu.edu.cn -
作者简介:田佩宁,女,博士研究生,20120900@bjtu.edu.cn -
基金资助:国家自然科学基金资助项目(71971021);基本科研业务费科研学术活动资助项目(2019JBM334)
Analysis of carbon emission level and intensity of China’s transportation industry and different transportation modes
TIAN Pei-Ning1,2(), MAO Bao-Hua1,2(), TONG Rui-Yong1,2, ZHANG Hao-Xiang3, ZHOU Qi1,2
- 1 Intergrated Transport Research Center of China, Beijing Jiaotong University, Beijing 100044, China
2 Key Laboratory of Transport Industry of Big Data Application Technologics for Comprehensive Transport, Beijing 100044, China
3 Beijing Urban Construction Design and Development Group Co., Ltd., Beijing 100037, China
-
Received:2022-08-01Revised:2022-10-22Online:2023-05-30Published:2023-02-13
摘要:
针对中国交通运输行业碳排放量核算边界、范围、方法不清的问题,采用自上而下和自下而上相结合的方法,通过运输方式分解,建立统计口径清晰、可与国际对标的交通碳排放测算模型,测算2019年中国交通运输业和各运输方式的CO2排放量,分析中国交通运输业的碳排放结构和不同运输方式的碳排放强度,为中国交通运输业制定碳减排路径提供理论基础。结果表明,2019年中国交通运输业的CO2排放量为12.74亿t,仅次于美国(17.88亿t),占全国CO2排放总量的比重为12.42%,占世界交通运输CO2排放总量的比重为14.82%。中国交通碳排放结构较分散,作为碳排放主体的道路运输排放占比(79.15%)低于德国、法国等欧洲国家(85.19%~96.69%),而航空、水路、轨道交通的碳排放占比则高出许多,分别为9.13%、7.06%、4.39%。碳排放强度由大到小排序为航空、公路、铁路、水运。
引用本文
田佩宁, 毛保华, 童瑞咏, 张皓翔, 周琪. 我国交通运输行业及不同运输方式的碳排放水平和强度分析[J]. 气候变化研究进展, 2023, 19(3): 347-356.
TIAN Pei-Ning, MAO Bao-Hua, TONG Rui-Yong, ZHANG Hao-Xiang, ZHOU Qi. Analysis of carbon emission level and intensity of China’s transportation industry and different transportation modes[J]. Climate Change Research, 2023, 19(3): 347-356.
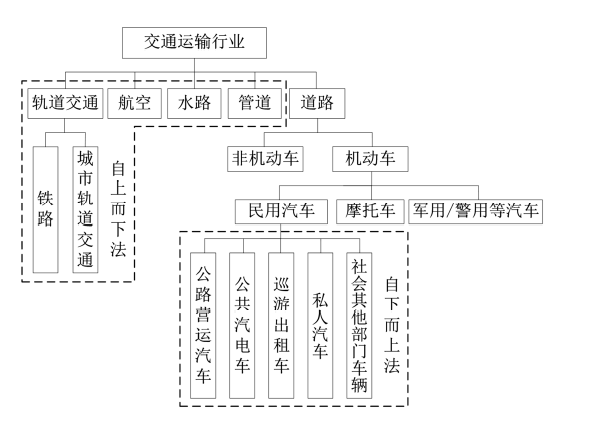
图1 交通运输行业分解 注:公共汽车和电车简称公共汽电车。
Fig. 1 Framework diagram of the transportation industry
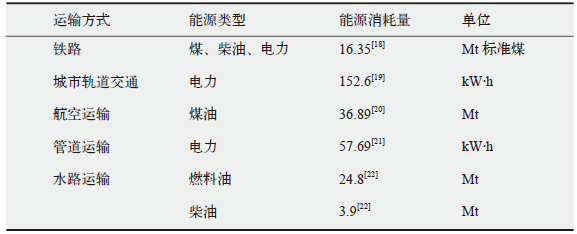 |
表1 2019年不同运输方式能源消耗量
Table 1 Energy consumption by mode of transport in 2019
| |
 |
表2 2019年道路运输各类型汽车的活动水平
Table 2 Activity level of all types of vehicles in road transport in 2019
| |
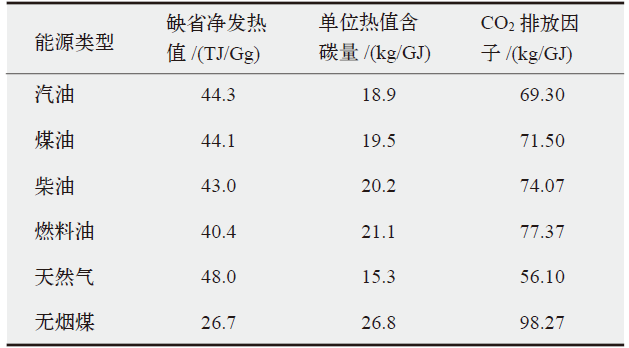 |
表3 碳排放系数相关参数取值[17,33]
Table 3 Values of the relevant parameters for carbon emission factors[17,33]
| |

图2 2019年交通运输行业及不同运输方式的CO2排放量 注:管道3.35,0.26%,表示管道CO2排放量为3.35Mt,占中国交通运输业CO2排放量的比重为0.26%;其他同。
Fig. 2 CO2 emissions from the transportation industry and different modes of transportation in 2019
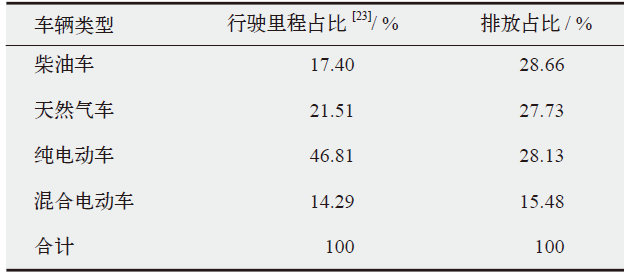 |
表4 2019年公共汽电车的碳排放量及行驶里程占比
Table 4 Carbon emissions and vehicle type share of public vehicles and trams in 2019
| |
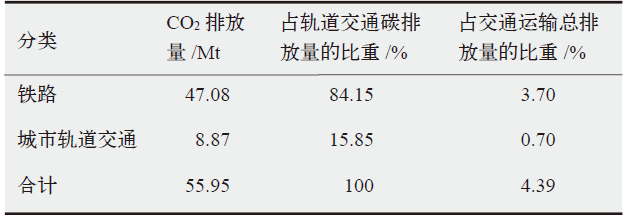 |
表5 2019年轨道交通碳排放量及构成
Table 5 Carbon emissions and composition of rail transit in 2019
| |
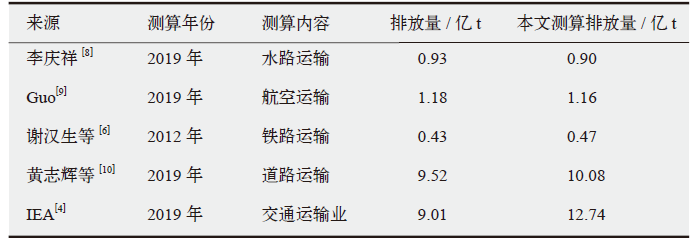 |
表6 与既有文献结果比较
Table 6 Comparison with established literature results
| |

图3 2019年排名前25国交通碳排放量及其占比[35] 排放量 占比
Fig. 3 Transportation carbon emissions and their share in the top 25 countries in 2019 [35]
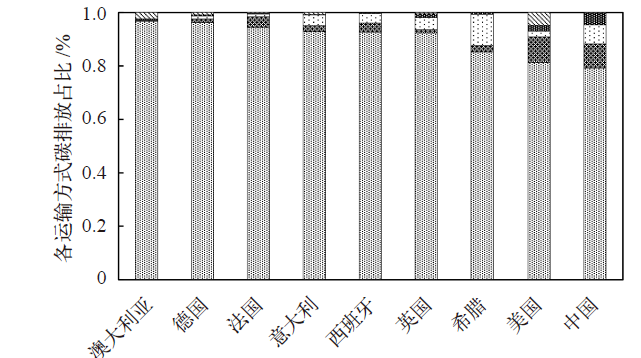
图4 2019年中国、美国[36]和2018年部分欧洲国家[37]交通运输业的碳排放结构 公路 航空 水运 铁路 其他运输方式
Fig. 4 Structure of carbon emissions from the transport sector in China, the United States in 2019 and selected European countries in 2018
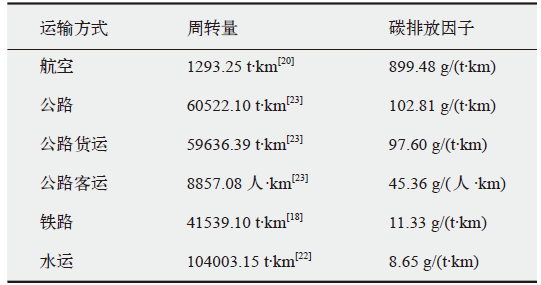 |
表7 2019年不同运输方式的单位周转量碳排放因子计算
Table 7 Calculation of carbon emission factors per unit of turnover for different modes of transport in 2019
| |
| [1] | IPCC. Global warming of 1.5℃ [R/OL]. 2018 [2022-10-20]. https://www.ipcc.ch/sr15/ |
| [2] | Hale T, Hsu A, Kuramochi T, et al. Net zero tracker [DB/OL]. 2022 [2022-10-20]. https://zerotracker.net/ |
| [3] | 李晓易, 吴睿. 交通运输温室气体核算边界和测算方法研究[J]. 气候变化研究进展, 2023, 19 (1): 84-90. |
| Li X Y, Wu R. Research on greenhouse gas emissions accounting boundaries and calculating method of the transport sector[J]. Climate Change Research, 2023, 19 (1): 84-90 (in Chinese) | |
| [4] | International Energy Agency (IEA). China key energy statiostics, 2020 [DB/OL]. 2022 [2022-10-20]. https://www.iea.org/countries/china |
| [5] | 贾顺平, 毛保华, 刘爽, 等. 中国交通运输能源消耗水平测算与分析[J]. 交通运输系统工程与信息, 2010, 10 (1): 22-27. |
| Jia S P, Mao B H, Liu S, et al. Calculation and analysis of transportation energy consumption level in China[J]. Journal of Transportation Systems Engineering and Information Technology, 2010, 10 (1): 22-27 (in Chinese) | |
| [6] | 谢汉生, 周新军, 黄茵, 等. 铁路运营碳排放测算及低碳效应评价研究[J]. 铁道工程学报, 2014 (3): 117-122. |
| Xie H S, Zhou X J, Huang Y, et al. Research on the measurement of carbon emission from railway operation and evaluation of low-carbon effect[J]. Journal of Railway Engineering Society, 2014 (3): 117-122 (in Chinese) | |
| [7] | 汪莹, 高佳钰, 雷雨轩. 我国铁路运营碳排放影响因素研究[J]. 铁道学报, 2020, 42 (4): 7-16. |
| Wang Y, Gao J Y, Lei Y X. A research of influence factors on carbon emission of railway in China[J]. Journal of The China Railway Society, 2020, 42 (4): 7-16 (in Chinese) | |
| [8] | 李庆祥. 我国水路运输碳排放现状及减碳路径分析[J]. 交通节能与环保, 2021, 17 (2): 1-4, 12. |
| Li Q X. Carbon emission status and carbon reduction path analysis of waterway transport in China[J]. Transport Energy Conservation & Environmental Protection, 2021, 17 (2): 1-4, 12 (in Chinese) | |
| [9] | Guo Y D. Analysis on emission reduction strategies of Chinese airlines under the dual carbon goals[J]. Journal of Global Economy, Business and Finance, 2022, 4 (2): 63-66 |
| [10] | 黄志辉, 纪亮, 尹洁, 等. 中国道路交通二氧化碳排放达峰路径研究[J]. 环境科学研究, 2022, 35 (2): 385-393. |
| Huang Z H, Ji L, Yin J, et al. Peak pathway of China’s road traffic carbon emissions[J]. Research of Environmental Sciences, 2022, 35 (2): 385-393 (in Chinese) | |
| [11] | 周琪, 梁肖, 黄俊生, 等. 城市轨道交通碳排放效率与影响因素研究[J/OL]. 交通运输系统工程与信息, 2022 [2023-01-14]. http://kns.cnki.net/kcms/detail/11.4520.U.20220930.1213.004.html. |
| Zhou Q, Liang X, Huang J S, et al. Carbon emission efficiency and influencing factors analysis of urban rail transit[J/OL]. Journal of Transportation Systems Engineering and Information Technology, 2022 [2023-01-14]. http://kns.cnki.net/kcms/detail/11.4520.U.20220930.1213.004.html (in Chinese) | |
| [12] |
Cifuentes F, González C M, Trejos E M, et al. Comparison of top-down and bottom-up road transport emissions through high-resolution air quality modeling in a city of complex orography[J]. Atmosphere, 2021, 12 (11): 1372
doi: 10.3390/atmos12111372 URL |
| [13] | Annadanam S K, Kota S H. Emission of greenhouse gases and criteria pollutants from railways in India estimated using a modified top-down approach[J]. Journal of Cleaner Production, 2018: 610-617 |
| [14] | Alam M S, Duffy P, Hyde B, et al. Improvement in the estimation and back-extrapolation of CO2 emissions from the Irish road transport sector using a bottom-up data modelling approach[J]. Transportation Research Part D, 2017: 18-32 |
| [15] | Fu M, Kelly J A, J Clinch P. Estimating annual average daily traffic and transport emissions for a national road network: a bottom-up methodology for both nationally-aggregated and spatially-disaggregated results[J]. Journal of Transport Geography, 2017: 186-195 |
| [16] | Wu T Y, Ng S T, Chen J. Deciphering the CO2 emissions and emission intensity of cement sector in China through decomposition analysis[J]. Journal of Cleaner Production, 2022: 352 |
| [17] | IPCC. IPCC 2006 guidelines for national greenhouse gas inventories [R/OL]. 2006 [2022-08-01]. https://www.ipcc.ch/report/2006-ipcc-guidelines-for-national-greenhouse-gas-inventories/ |
| [18] | 国家铁路局. 2019年铁道统计公报[R/OL]. 2020 [2022-10-20]. http://www.nra.gov.cn/xwzx/zlzx/hytj/202204/P020220902306747176052.pdf. |
| National Railway Administration of The People’s Republic of China. Railways statistical bulletin 2019 [R/OL]. 2020 [2022-10-20]. http://www.nra.gov.cn/xwzx/zlzx/hytj/202204/P020220902306747176052.pdf (in Chinese) | |
| [19] | 中国城市轨道交通协会. 城市轨道交通2019年度统计和分析报告 [R/OL]. 2020 [2022-10-20]. https://www.camet.org.cn/tjxx/5133. |
| China Association of Metros. Urban rail transit annual statistics and analysis report 2019 [R/OL]. 2020 [2022-10-20]. https://www.camet.org.cn/tjxx/5133 (in Chinese) | |
| [20] | 中国民用航空局发展计划司. 从统计看民航2020 [M]. 北京: 中国民航出版社, 2021: 114. |
| Civil Aviation Administration of China. Civil aviation in statistical terms 2020 [M]. Beijing: China Civil Aviation Publishing House, 2021: 114 (in Chinese) | |
| [21] | 中国电力企业联合会. 行业统计分析 [DB/OL]. 2020 [2022-10-20]. https://cec.org.cn/index.html. |
| China Electricity Council. Statistical analysis of the industry [EB/OL]. 2020 [2022-10-20]. https://cec.org.cn/index.html (in Chinese) | |
| [22] | 王庆一. 2020能源数据 [R/OL]. 2020 [2022-10-20]. https://www.efchina.org/Reports-zh/report-lceg-20210430-3-zh. |
| Wang Q Y. 2020 energy data [R/OL]. 2020 [2022-10-20]. https://www.efchina.org/Reports-zh/report-lceg-20210430-3-zh (in Chinese) | |
| [23] | 交通运输部. 2019年交通运输行业发展统计公报[J]. 交通财会, 2020 (6): 86-91. |
| Ministry of Transport of The People’s Republic of China. Statistical bulletin on the development of The transport sector in 2019[J]. Finance & Accounting for Transport, 2020 (6): 86-91 (in Chinese) | |
| [24] | 清华大学. 道路机动车排放清单编制技术指南(试行)[R/OL]. 2014 [2022-10-20]. https://www.mee.gov.cn/gkml/hbb/bgth/201407/W020140708387895271474.pdf. |
| Tsinghua University. Technical guide for the development of road motor vehicle emission inventories (trial) [R/OL]. 2014 [2022-10-20]. https://www.mee.gov.cn/gkml/hbb/bgth/201407/W020140708387895271474.pdf (in Chinese) | |
| [25] | 湖南省人民政府. 2020年长沙全部使用新能源公交车[EB/OL]. 2017 [2022-10-20]. http://www.hunan.gov.cn/hnyw/szdt/201705/t20170523_4810282.html. |
| People’s Government of Hunan Province. All new energy buses to be used in Changsha by 2020 [EB/OL]. 2017 [2022-10-20]. http://www.hunan.gov.cn/hnyw/szdt/201705/t20170523_4810282.html (in Chinese) | |
| [26] | 长安大学. 2019中国公路货运大数据报告[R/OL]. 2020 [2022-10-20]. https://max.book118.com/html/2020/0408/6202044142002153.shtm. |
| Chang’an University. 2019 China road freight big data report [R/OL]. 2020 [2022-10-20]. https://max.book118.com/html/2020/0408/6202044142002153.shtm (in Chinese) | |
| [27] | 国家能源局. 经济又环保江西省多地运营天然气公交车 [EB/OL]. 2012 [2022-10-19]. http://www.nea.gov.cn/2012-10/19/c_131915953.htm. |
| National Energy Administration. Economical and environmentally friendly natural gas buses operating in many parts of Jiangxi Province [EB/OL]. 2012 [2022-10-19]. http://www.nea.gov.cn/2012-10/19/c_131915953.htm (in Chinese) | |
| [28] | 滕欣余, 张钰. 2019年新能源公交客车运行大数据研究报告 [R/OL]. 2019 [2022-10-20]. https://www.doc88.com/p-9993922908077.html. |
| Teng X Y, Zhang Y. 2019 new energy bus operation big data research report [R/OL]. 2019 [2022-10-20]. https://www.doc88.com/p-9993922908077.html (in Chinese) | |
| [29] | 北京交通发展研究院. 北京交通发展年度报告(2020) [R/OL]. 2020 [2022-10-20]. https://www.bjtrc.org.cn/List/index/cid/7.html. |
| Beijing Transport Institute. Beijing transport development annual report (2020) [R/OL]. 2020 [2022-10-20]. https://www.bjtrc.org.cn/List/index/cid/7.html (in Chinese) | |
| [30] | 中华人民共和国工业和信息化部. 2019年度中国乘用车企业平均燃料消耗量与新能源汽车积分情况公告[R/OL]. 2020 [2022-10-20]. https://ythxxfb.miit.gov.cn/ythzxfwpt/hlwmh/zcwj/xzxk/clsczr/art/2020/art_a14a402f2b5b4ac6addad2998f845fd0.html. |
| Ministry of Industry and Information Technology of The People’s Republic of China. Announcement of average fuel consumption and new energy vehicle credits of Chinese passenger vehicle enterprises for 2019 [R/OL]. 2020 [2022-10-20]. https://ythxxfb.miit.gov.cn/ythzxfwpt/hlwmh/zcwj/xzxk/clsczr/art/2020/art_a14a402f2b5b4ac6addad2998f845fd0.html (in Chinese) | |
| [31] | 国家数据. 年度数据: 私人汽车拥有量[DB/OL]. 2020 [2022-10-15]. https://data.stats.gov.cn/easyquery.htm?cn=C01. |
| National Data. Annual data: private car ownership [DB/OL]. 2020 [2022-10-15]. https://data.stats.gov.cn/easyquery.htm?cn=C01 (in Chinese) | |
| [32] |
Ou S Q, Yu R J, Lin Z H, et al. Intensity and daily pattern of passenger vehicle use by region and class in China: estimation and implications for energy use and electrification[J]. Mitigation and Adaptation Strategies for Global Change, 2019, 25 (3): 307-327
doi: 10.1007/s11027-019-09887-0 |
| [33] | IPCC. 2019 refinement to the 2006 IPCC guidelines for national greenhouse gas inventories [R/OL]. 2006 [2022-7-20]. https://www.ipcc.ch/report/2019-refinement-to-the-2006-ipcc-guidelines-for-national-greenhouse-gas-inventories/ |
| [34] | 中华人民共和国生态环境部. 关于做好2022年企业温室气体排放报告管理相关重点工作的通知 [EB/OL]. 2022 [2022-10-20]. https://www.mee.gov.cn/xxgk2018/xxgk/xxgk06/202203/t20220315_971468.html. |
| Ministry of Ecology and Environment of The People’s Republic of China. Notice on the key tasks related to the management of corporate greenhouse gas emissions reporting in 2022 [EB/OL]. 2022 [2022-10-20]. https://www.mee.gov.cn/xxgk2018/xxgk/xxgk06/202203/t20220315_971468.html (in Chinese) | |
| [35] | Emissions Database for Global Atmospheric Research. Emissions database for global atmospheric research: fossil CO2 booklet 2020 [DB/OL]. 2020 [2022-10-20]. https://edgar.jrc.ec.europa.eu/report_2020 |
| [36] | United States Environmental Protection Agency. Inventory of U. S. greenhouse gas emissions and sinks 1990-2019 [DB/OL]. 2021 [2022-10-20]. https://www.epa.gov/ghgemissions/inventory-us-greenhouse-gas-emissions-and-sinks-1990-2019 |
| [37] | European Environment Agency. EEA greenhouse gases: data viewer [DB/OL]. 2021 [2022-10-18]. https://www.eea.europa.eu/data-and-maps/data/data-viewers/greenhouse-gases-viewer |
| [1] | 姜鹏南, 窦艳伟, 白富丽, 李一希, 赵星辰, 张旭, 陈子薇, 胡建信. 海南省房间空调行业温室气体协同减排潜力和效益分析[J]. 气候变化研究进展, 2023, 19(4): 496-507. |
| [2] | 徐天昊, 胡姗, 杨子艺, 江亿. 中国瑞典建筑碳排放对比及对中国建筑碳中和路径的启示[J]. 气候变化研究进展, 2023, 19(3): 305-319. |
| [3] | 李丹阳, 陈文颖. 碳中和目标下全球交通能源转型路径[J]. 气候变化研究进展, 2023, 19(2): 203-212. |
| [4] | 谭显春, 高瑾昕, 曾桉, 幸绣程. 绿色金融改革创新试验区政策对碳排放的影响评估[J]. 气候变化研究进展, 2023, 19(2): 213-226. |
| [5] | 杨姗姗, 郭豪, 杨秀, 李政. 双碳目标下建立碳排放总量控制制度的思考与展望[J]. 气候变化研究进展, 2023, 19(2): 191-202. |
| [6] | 樊星, 李路, 秦圆圆, 高翔. 主要发达经济体从碳达峰到碳中和的路径及启示[J]. 气候变化研究进展, 2023, 19(1): 102-115. |
| [7] | 李品, 谢晓敏, 黄震. 德国能源转型进程及对中国的启示[J]. 气候变化研究进展, 2023, 19(1): 116-126. |
| [8] | 郭偲悦, 耿涌. IPCC AR6报告解读:工业部门减排[J]. 气候变化研究进展, 2022, 18(5): 574-579. |
| [9] | 白泉, 胡姗, 谷立静. 对IPCC AR6报告建筑章节的介绍和解读[J]. 气候变化研究进展, 2022, 18(5): 557-566. |
| [10] | 闫书琪, 李素梅, 吕鹤, 陈莎, 刘影影, 王宏涛, 刘会政, 陈前利. 基于混合LCA的新疆地区电力生产水足迹分析及碳中和目标下的变化[J]. 气候变化研究进展, 2022, 18(3): 294-304. |
| [11] | 曾桉, 谭显春, 王毅, 高瑾昕. 国际气候投融资监测、报告与核证制度及启示[J]. 气候变化研究进展, 2022, 18(2): 215-229. |
| [12] | 廖虹云, 赵盟, 李艳霞. 北京市高分辨率CO2排放清单研究[J]. 气候变化研究进展, 2022, 18(2): 188-195. |
| [13] | 张浩楠, 申融容, 张兴平, 康俊杰, 袁家海. 中国碳中和目标内涵与实现路径综述[J]. 气候变化研究进展, 2022, 18(2): 240-252. |
| [14] | 任佳雪, 高庆先, 陈海涛, 孟丹, 张阳, 马占云, 刘倩, 唐甲洁. 碳中和愿景下的污水处理厂温室气体排放情景模拟研究[J]. 气候变化研究进展, 2021, 17(4): 410-419. |
| [15] | 姜克隽, 冯升波. 走向《巴黎协定》温升目标:已经在路上[J]. 气候变化研究进展, 2021, 17(1): 1-6. |
| 阅读次数 | ||||||
|
全文 |
|
|||||
|
摘要 |
|
|||||