气候变化研究进展 ›› 2025, Vol. 21 ›› Issue (2): 153-168.doi: 10.12006/j.issn.1673-1719.2024.280
中国气候变化检测归因研究进展
孙颖1( ), 王东阡1, 张学斌2
- 1 气候系统预测与变化应对全国重点实验室,国家气候中心,北京 100081
2 维多利亚大学太平洋气候影响联盟,不列颠哥伦比亚省 维多利亚 V8P 5C2,加拿大
-
收稿日期:2024-11-04修回日期:2024-12-18出版日期:2025-03-30发布日期:2025-02-28 -
作者简介:孙颖,女,研究员,sunying@cma.gov.cn -
基金资助:国家自然科学基金(42025503);国家自然科学基金(U2342228);中国气象局重点创新团队“气候变化检测与应对”(CMA2022ZD03)
Progress in climate change detection and attribution studies in China
SUN Ying1(), WANG Dong-Qian1, ZHANG Xue-Bin2
- 1 State Key Laboratory of Climate System Prediction and Risk Management, National Climate Centre, Beijing 100081, China
2 Pacific Climate Impacts Consortium, University of Victoria, Victoria V8P 5C2, British Columbia, Canada
-
Received:2024-11-04Revised:2024-12-18Online:2025-03-30Published:2025-02-28
摘要:
作为气候变化研究中的重大前沿科学领域,气候变化检测归因旨在揭示气候变化的原因,量化外强迫对气候变化的影响程度。这些问题不仅是气候变化科学研究的核心问题,也是气候变化国际谈判的热点和焦点问题。我国在检测归因领域总体起步较晚,但是近十年来,在中国科学家的努力下,我们从无到有实现了对中国区域气候变化和极端事件归因认识的若干突破,在中国气候变化检测归因领域取得了显著的研究进展。文中对该领域主要研究进展的回顾和梳理表明:20世纪中期以来,以温室气体排放为主的人类活动是中国区域变暖,极端温度频率、强度和持续时间变化的主要驱动因子。人类活动对极端降水变化产生了清晰的影响,同时也可在某些类型干旱的变化中发现人类活动的信号。百年时间尺度上,人类活动的信号可以在平均和极端温度指标的变化中检测到。对于重大高影响极端事件,人为强迫增加了极端高温事件发生的概率,减少了极端低温事件发生的概率。人类活动对强降水事件、干旱和复合事件的归因研究结论一致性较低,同时受到了事件定义和归因方法等的影响,要评估得出人类活动对这类事件影响程度的一般性结论仍然非常困难。未来需要加强对降水、干旱、大气环流、复合事件等变化的检测归因,理解并提高极端事件归因结果的可靠性。
引用本文
孙颖, 王东阡, 张学斌. 中国气候变化检测归因研究进展[J]. 气候变化研究进展, 2025, 21(2): 153-168.
SUN Ying, WANG Dong-Qian, ZHANG Xue-Bin. Progress in climate change detection and attribution studies in China[J]. Climate Change Research, 2025, 21(2): 153-168.

图1 基于概率的事件归因 注:图中红色和蓝色分别表示有和没有人类活动影响下气候变量的概率密度分布(实线)和事件的发生概率(P0和 P1,阴影),红色虚线表示对未来可能的气候变量概率密度的预估,本图根据文献[23]重绘。
Fig. 1 An illustration of the Probability Density Functions (PDFs)
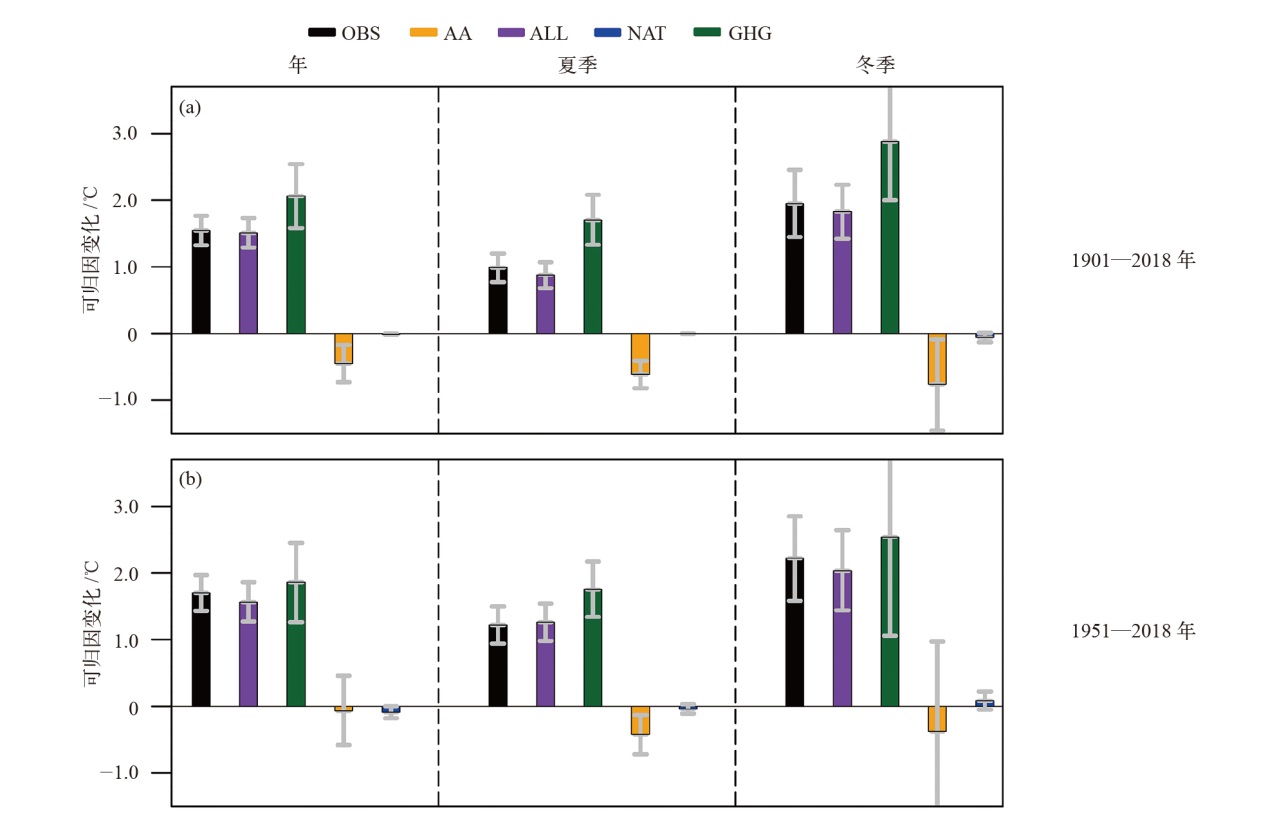
图2 基于百年均一化观测和CMIP6模式资料的中国平均气温变化的检测归因[32] (a) 1901—2018年,(b) 1951—2018年 注:图中显示为观测到的中国年平均气温变化趋势的最优估计(OBS)以及不同因子贡献的最优估计值,包括全强迫(ALL)、温室气体(GHG)、人为气溶胶(AA)和自然强迫(NAT)。图中的误差栏表示5%~95%的置信区间。
Fig. 2 Detection and attribution of mean temperature changes in China based on station observations and CMIP6 model data. The figure shows attributable changes from ALL, GHG, AA, and NAT forcings to observational trend (OBS) in annual, summer (JJA), and winter (DJF) temperature for the 1901-2018 (a) and 1951-2018 (b) periods[32]
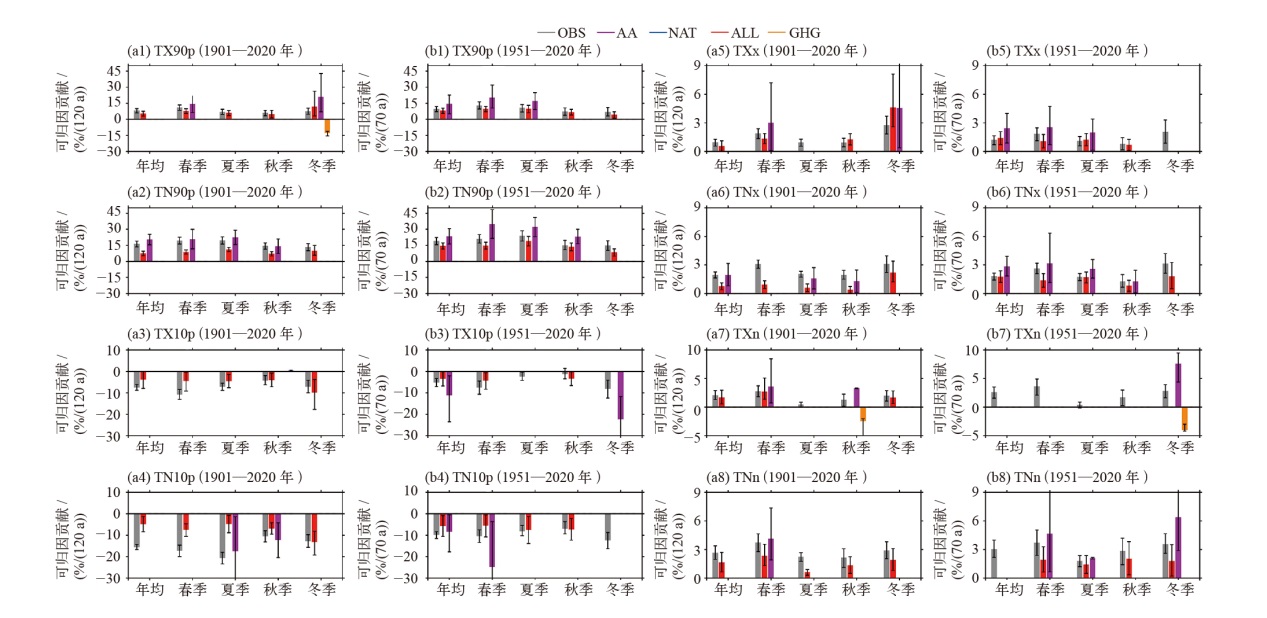
图3 基于中国东部(105°E以东)百年逐日观测和CMIP6模式资料的极端气温指标变化检测归因[44](a)1901—2020年,(b) 1951—2020年 注:图中显示为观测到的极端温度变化趋势的最优估计(OBS)以及不同因子贡献的最优估计值,包括全强迫(ALL)、温室气体(GHG)、人为气溶胶(AA)和自然强迫(NAT),误差栏表示5%~95%的置信区间。
Fig. 3 Detection and attribution of changes in extreme temperature indices based on centennial observations and CMIP6 model data in eastern China. (The figure shows attributable trends to ALL, GHG, AA, and NAT signals compared with the observed trends (OBS) for annual and seasonal indices during 1901-2020 (a) and 1951-2020 (b))[44]
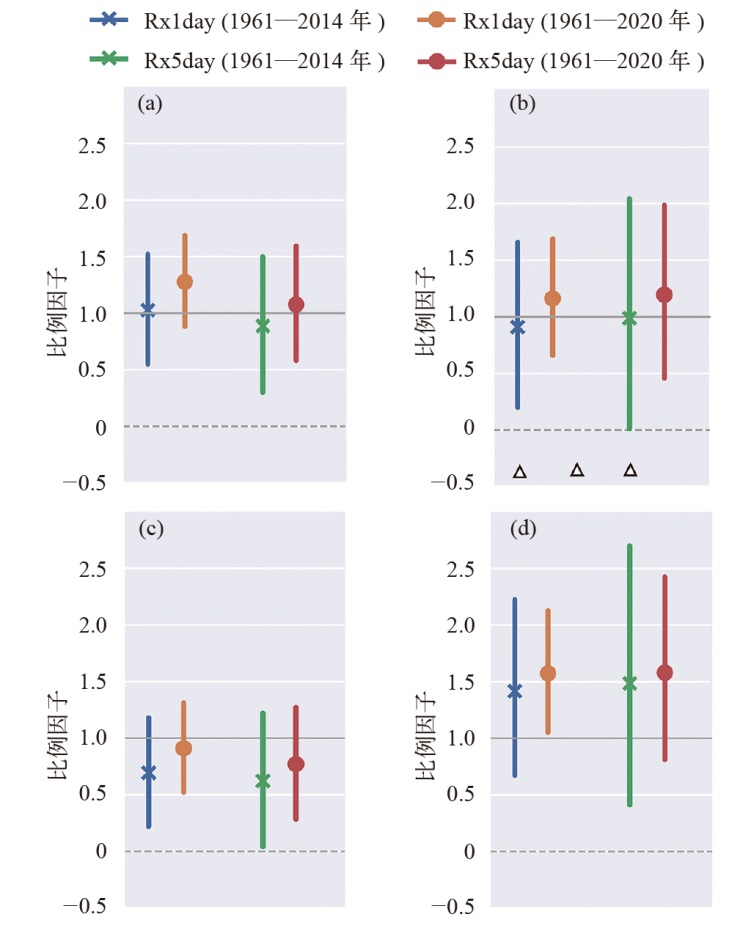
图4 中国区域Rx1day和Rx5day单信号ALL的比例因子及其5%~95%置信区间的范围及最佳估计值[48] 注:(a、c)图为直接利用极端降水距平进行区域平均计算后得到的比例因子,(b、d)图为将极端降水进行概率拟合转换后再进行平均计算后得到的比例因子。(a、b)图为基于站点数据的结果,(c、d)图为基于格点降水数据集的结果。三角形表示模式模拟的变率太高。
Fig. 4 The best estimates of scaling factors and their 5%-95% confidence intervals of the ALL signal in single-signal analyses for China under different configurations of the analyses[48]
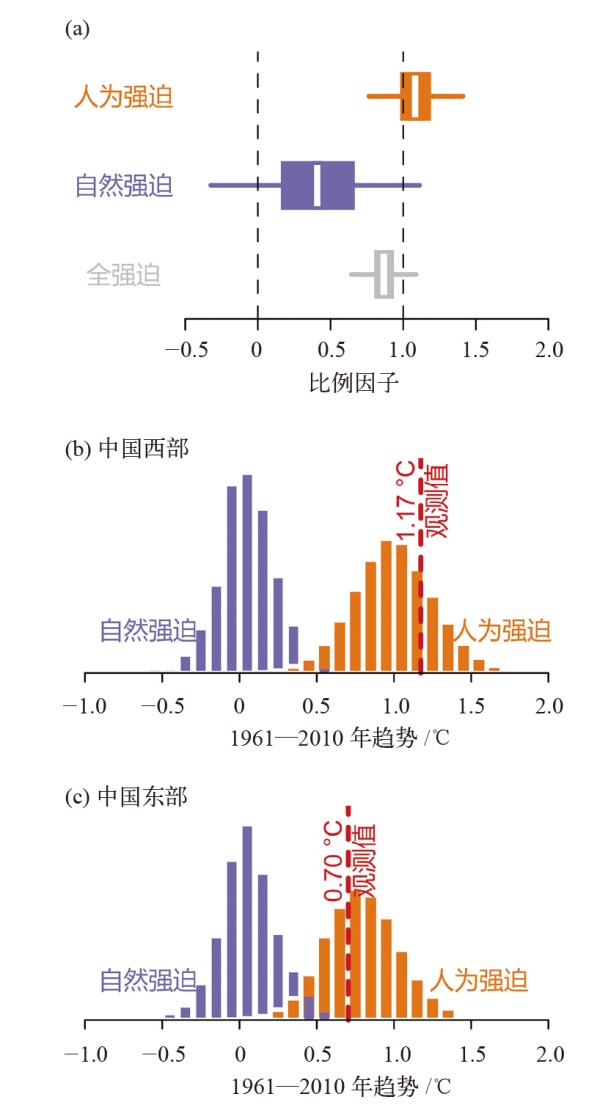
图5 中国夏季平均湿球温度全强迫(ALL)单信号和人为强迫(ANT)、自然强迫(NAT)双信号比例因子最佳估计及其25%~75%(箱型图)和5%~95%(横线)置信区间范围(a),中国西部地区(b)和东部地区(c)在人为辐射强迫(ANT,橙色)和自然强迫(NAT,蓝色)下1961—2010年夏季平均湿球温度概率密度分布[57]
Fig. 5 Climatic conditions that are increasingly conducive to summer heat stress as measured by summer mean wet bulb globe temperature (WGBT) in China have human-induced origins: estimates of scaling factors for one-signal (ALL) and two-signal (ANT and NAT) ?ngerprint analyses (a). The white lines mark the scaling-factor best estimates. The width of the boxplot represents the 25%-75% un-certainty ranges of the scaling-factor estimates, and the whiskers extend to the 5%-95% uncertainties ranges. Also shown are trend histograms of the observation-constrained 1961-2010 summer mean WBGT in a climate with anthropogenic-only forcings (orange) and with natural-only forcings (blue) for western (b) and eastern (c) China. The observed trends are marked by vertical red lines[57]
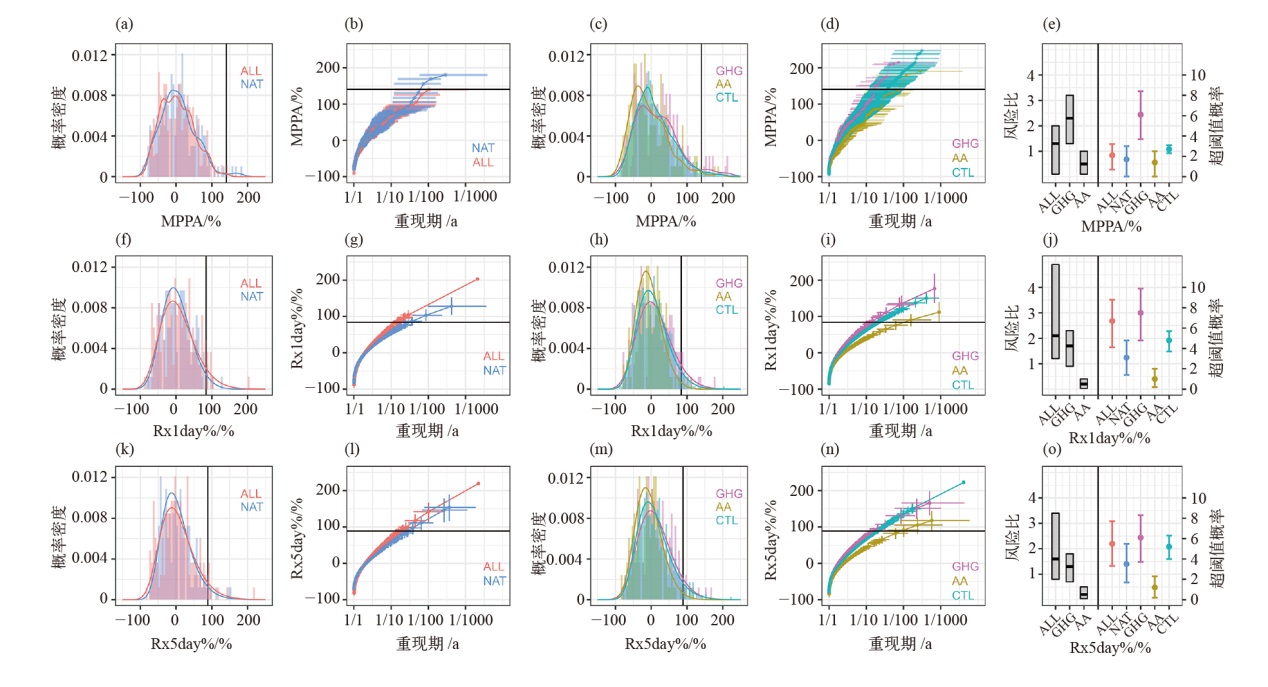
图6 人为辐射强迫对2021年9月中国北方创纪录降水偏多事件的影响[82] (a~e)月平均降水距平百分率(MPPA)的概率密度分布,重现期分布和风险比及其bootstrap检验结果,ALL(红色)、NAT(蓝色)、GHG(紫色)、AA(橙色)和控制试验(CTL,绿色)情景结果使用颜色区分;(f~j)为最大日降水距平百分率(Rx1day%)结果;(k~o)为最大连续5 d降水距平百分率(Rx5day%)结果
Fig. 6 Fitted distributions, return periods, risk ratios, and exceedance probabilities of domain-averaged MPPA (a-e) by the empirical probability formula and Rx1day% (f-j) and Rx5day% (k-o) by a GEV distribution in September 2021 over northern China based on ALL (red), NAT (blue), GHG (purple), AA (orange), and CTL (green) ensembles. Black lines indicate the observed threshold values of the September 2021 event, i.e., 140.5%, 83.87%, and 88.82% for MPPA, Rx1day%, and Rx5day%, respectively. Panels (e), (j), and (o) are best estimates and 90% confidence intervals of risk ratios (left, gray boxes) and exceedance probabilities (right, color bars). The error bars and boxes mark 5%-95% uncertainty ranges estimated via the bootstrapping method (N=1000)[82]
| [1] | WMO. The state of the global climate 2023 report[R/OL]. 2024 [2024-11-01]. https://wmo.int/publication-series/state-of-global-climate-2023 |
| [2] | IPCC. Climate change: the physical science basis[M]. Cambridge: Cambridge University Press, 2021 |
| [3] | 《第四次气候变化国家评估报告》编写委员会. 第四次气候变化国家评估报告[M]. 北京: 科学出版社, 2022. |
| Committee of Chinese National Assessment Report on Climate Change. The fourth China’s national assessment report on climate change[M]. Beijing: Science Press, 2022 (in Chinese) | |
| [4] | 秦大河, 翟盘茂. 中国气候与生态环境演变[M]. 北京: 科学出版社, 2021. |
| Qin D H, Zhai P M. Climate and environment changes in China[M]. Beijing: Science Press, 2021 (in Chinese) | |
| [5] | Sun Y, Zhang X B, Ding Y H, et al. Understanding human influence on climate change in China[J]. National Science Review, 2021, 9 (3). DOI: 10.1093/nsr/nwab113 |
| [6] | Stott P A, Stone D A, Allen M R. Human contribution to the European heatwave of 2003[J]. Nature, 2004, 432: 610-614 |
| [7] | Seneviratne S I, Nicholls N, Easterling D, et al. Managing the risks of extreme events and disasters to advance climate change adaptation[M]. Cambridge: Cambridge University Press, 2012 |
| [8] | Peterson T C, Stott P A, Herring S. Explaining extreme events of 2011 from a climate perspective[J]. Bulletin of the American Meteorological Society, 2012, 93 (7). DOI: 10.1175/bams-d-12-00021.1 |
| [9] | Herring S C, Christidis N, Hoell A, et al. Explaining extreme events of 2020 from a climate perspective[J]. Bulletin of the American Meteorological Society, 2022, 103 (3). DOI: 10.1175/BAMS-ExplainingExtremeEvents2020.1 |
| [10] | Ciavarella A, Christidis N, Andrews M, et al. Upgrade of the HadGEM3-A based attribution system to high resolution and a new validation framework for probabilistic event attribution[J]. Weather and Climate Extremes, 2018, 20: 9-32 |
| [11] | Sun Y, Chao Q C, Zhao B T, et al. Special topic on explaining China’s climate in 2021[J]. Advances in Climate Change Research, 2022, 13 (6): 769-938 |
| [12] | Sun Y, Zhang X B, Zwiers F W, et al. Rapid increase in the risk to extreme summer heat in eastern China[J]. Nature Climate Change, 2014, 4: 1082-1085 |
| [13] | Hergerl G C, Hoegh-Guldberg O, Casassa G, et al. Good practice guidance paper on detection and attribution related to anthropogenic climate change[R/OL]. 2010 [2024-11-01]. http://www.ipcc.ch/pdf/supporting-material |
| [14] | 孙颖, 尹红, 田沁花, 等. 全球和中国区域近50年气候变化检测归因研究进展[J]. 气候变化研究进展, 2013, 9 (4): 235-245. |
| Sun Y, Yin H, Tian Q H, et al. Recent progress in studies of climate change detection and attribution in the globe and China in the past 50 years[J]. Climate Change Research, 2013, 9 (4): 235-245 (in Chinese) | |
| [15] | IPCC. Climate change 2007: the physical science basis[M]. Cambridge: Cambridge University Press, 2007 |
| [16] | IPCC. Climate change 2013: the physical science basis[M]. Cambridge: Cambridge University Press, 2013 |
| [17] | NNational Academies of Sciences, Engineering, and Medicine (NASEM). Attribution of extreme weather events in the context of climate change[M]. Washington, DC: the National Academies Press, 2016 |
| [18] | Hasselmann K F. On the signal-to-noise problem in atmospheric response studies[C]. Joint Conference of Royal Meteorological Society, American Meteorological Society, Deutsche Meteorologische Gesellschaft and the Royal Society, 1979: 251-259 |
| [19] | Allen M R, Stott P A. Estimating signal amplitudes in optimal fingerprinting, part I: theory[J]. Climate Dynamics, 2003, 21: 477-491 |
| [20] | Allen M R, Tett S F B. Checking for model consistency in optimal fingerprinting[J]. Climate Dynamics, 1999, 15: 419-434 |
| [21] | Ribes A, Planton S, Terray L. Application of regularised optimal fingerprinting to attribution. Part I: method, properties and idealised analysis[J]. Climate Dynamics, 2013, 41: 2817-2836 |
| [22] | Bindoff N L, Stott P A, Achutarao K M, et al. Detection and attribution of climate change:from global to regional. In: climate change 2013: the physical science basis[M]. Cambridge: Cambridge University Press, 2014 |
| [23] | Stott P A, Christidis N, Otto F E L, et al. Attribution of extreme weather and climate-related events[J]. WIREs Climate Change, 2016, 7: 23-41 |
| [24] | Angelil O, Stone D, Wehner M, et al. An independent assessment of anthropogenic attribution statements for recent extreme temperature and rainfall events[J]. Journal of Climate, 2017, 30 (1): 5-16 |
| [25] | Easterling D R, Kunkel K E, Wehner M F, et al. Detection and attribution of climate extremes in the observed record[J]. Weather and Climate Extremes, 2016, 11: 17-27 |
| [26] | van Oldenborgh G J, Haarsma R, de Vries H, et al. Cold extremes in North America vs. mild weather in Europe: the winter of 2013-14 in the context of a warming world[J]. Bulletin of the American Meteorological Society, 2015, 96 (5): 707-714 |
| [27] | Yiou P, Vautard R, Naveau P, et al. Inconsistency between atmospheric dynamics and temperatures during the exceptional 2006/2007 fall/winter and recent warming in Europe[J]. Geophysical Research Letters, 2007, 34 (21): L21808 |
| [28] | Shepherd T G. A common framework for approaches to extreme event attribution[J]. Current Climate Change Reports, 2016, 2: 28-38 |
| [29] | Trenberth K E, Fasullo J T, Shepherd T G. Attribution of climate extreme events[J]. Nature Climate Change, 2015, 5: 725-730 |
| [30] | 巢清尘, 袁佳双, 王朋岭, 等. 中国气候变化蓝皮书2024[M]. 北京: 科学出版社, 2024. |
| Chao Q Q, Yuan J S, Wang P L, et al. Blue book on climate change in China 2024[M]. Beijing: Science Press, 2024 (in Chinese) | |
| [31] |
Sun Y, Zhang X B, Ren G Y, et al. Contribution of urbanization to warming in China[J]. Nature Climate Change, 2016, 6: 706-709
doi: 10.1038/NCLIMATE2956 |
| [32] | Yin H, Sun Y. Anthropogenic influence on temperature change in China over the period 1901-2018[J]. Journal of Climate, 2023, 36 (7): 2131-2146 |
| [33] | Wang Y J, Sun Y, Hu T, et al. Attribution of temperature changes in western China[J]. International Journal of Climatology, 2018, 38 (2): 742-750 |
| [34] | Yin H, Sun Y, Li M H. Reconstructed temperature change in late summer over the eastern Tibetan Plateau since 1867 CE and the role of anthropogenic forcing[J]. Global and Planetary Change, 2022, 208: 103715. DOI: 10.1016/j.gloplacha.2021.103715 |
| [35] | Sun Y, Hu T, Zhang X B. Anthropogenic influence on altitudinally amplified temperature change in the Tibetan Plateau[J]. Environmental Research Letters, 2024, 19: L054012. DOI: 10.1088/1748-9326/ad3bd3 |
| [36] | Liu R, Liu S C, Cicerone R J, et al. Trends of extreme precipitation in eastern China and their possible causes[J]. Advances in Atmospheric Sciences, 2015, 32: 1027-1037 |
| [37] | Ma S M, Zhou T J, Stone D A, et al. Detectable anthropogenic shift toward heavy precipitation over eastern China[J]. Journal of Climate, 2017, 30: 1381-1396 |
| [38] | Li M, Li C, Jiang Z H, et al. Deciphering China’s complex pattern of summer precipitation trends[J]. Earth’s Future, 2022, 10 (9): e2022EF002797 |
| [39] | Jiang J, Zhou T, Qian Y, et al. Precipitation regime changes in High Mountain Asia driven by cleaner air[J]. Nature, 2023, 623: 544-549 |
| [40] | Hu T, Sun Y. Anthropogenic influence on extreme temperatures in China based on CMIP6 models[J]. International Journal of Climatology, 2021, 42 (5): 2981-2995 |
| [41] | Lu C H, Sun Y, Wan H, et al. Anthropogenic influence on the frequency of extreme temperatures in China[J]. Geophysical Research Letters, 2016, 43 (12). DOI: 10.1002/2016gl069296 |
| [42] | Yin H, Sun Y, Wan H, et al. Detection of anthropogenic influence on the intensity of extreme temperatures in China[J]. International Journal of Climatology, 2017, 37: 1229-1237 |
| [43] | Sun Y, Hu T, Zhang X B, et al. Contribution of global warming and urbanization to changes in temperature extremes in eastern China[J]. Geophysical Research Letters, 2019, 46 (20): 11426-11434 |
| [44] | Hu T, Sun Y, Zheng X, et al. Anthropogenic influence on seasonal extreme temperatures in eastern China at century scale[J]. Weather and Climate Extremes, 2024, 44: 100675. DOI: 10.1016/j.wace.2024.100675 |
| [45] | Li H X, Chen H P, Wang H J. Effects of anthropogenic activity emerging as intensified extreme precipitation over China[J]. Journal of Geophysical Research: Atmospheres, 2017, 122 (13): 6899-6914 |
| [46] | Li W, Jiang Z H, Zhang X B, et al. On the emergence of anthropogenic signal in extreme precipitation change over China[J]. Geophysical Research Letters, 2018, 45 (17): 9179-9185 |
| [47] | Chen H P, Sun J Q. Contribution of human influence to increased daily precipitation extremes over China[J]. Geophysical Research Letters, 2017, 44 (5): 2436-2444 |
| [48] | Dong S Y, Sun Y, Zhang X B. Attributing observed increase in extreme precipitation in China to human influence[J]. Environmental Research Letters, 2022, 17 (9): L095005 |
| [49] | Chen H P, Sun J Q. Changes in drought characteristics over China using the standardized precipitation evapotranspiration index[J]. Journal of Climate, 2015, 28 (13): 5430-5447 |
| [50] | Chen H P, Sun J Q. Anthropogenic warming has caused hot droughts more frequently in China[J]. Journal of Hydrology, 2017, 544: 306-318 |
| [51] |
Yuan X, Wang L, Wu P, et al. Anthropogenic shift towards higher risk of flash drought over China[J]. Nature Communications, 2019, 10 (1): 4661
doi: 10.1038/s41467-019-12692-7 pmid: 31604952 |
| [52] | Li H, Chen H, Sun B, et al. A detectable anthropogenic shift toward intensified summer hot drought events over northeastern China[J]. Earth and Space Science, 2020, 7 (1): e2019EA000836 |
| [53] | Zhang X Y, Yu J H, Li L Z X, et al. Role of anthropogenic climate change in autumn drought trend over China from 1961 to 2014[J]. Journal of Meteorological Research, 2022, 36 (2): 251-260 |
| [54] |
Wang J, Chen Y, Tett S F B, et al. Anthropogenically-driven increases in the risks of summertime compound hot extremes[J]. Nature Communications, 2020, 11 (1): 528
doi: 10.1038/s41467-019-14233-8 pmid: 32047147 |
| [55] | Wang D Q, Sun Y. Long-term changes in extreme wet bulb globe temperature over China[J]. Journal of Meteorological Research, 2021, 35 (6): 975-986 |
| [56] | Li W L, Sun B, Wang H J, et al. Anthropogenic impact on the severity of compound extreme high temperature and drought/rain events in China[J]. NPJ Climate and Atmospheric Science, 2023, 6 (1): 79 |
| [57] | Li C, Sun Y, Zwiers F, et al. Rapid warming in summer wet bulb globe temperature in China with human-induced climate change[J]. Journal of Climate, 2020, 33 (13): 5697-5711 |
| [58] | Wang X X, Lang X M, Jiang D B. Detectable anthropogenic influence on summer compound hot events over China from 1965 to 2014[J]. Environmental Research Letters, 2022, 17 (3): L034042 |
| [59] | Li W, Jiang Z H, Li L et al. Detection and attribution of changes in summer compound hot and dry events over northeastern China with CMIP6 models[J]. Journal of Meteorological Research, 2022, 36 (1): 37-48 |
| [60] | Wang J, Chen Y, Liao W, et al. Anthropogenic emissions and urbanization increase risk of compound hot extremes in cities[J]. Nature Climate Change, 2021, 11 (12): 1084-1089 |
| [61] | Miao C Y, Sun Q H, Kong D X, et al. Record-breaking heat in Northwest China in July 2015: analysis of the severity and underlying causes[J]. Bulletin of the American Meteorological Society, 2016, 97 (12): 97-101 |
| [62] | Zhou C L, Wang K C, Qi D, et al. Attribution of a record-breaking heatwave event in summer 2017 over the Yangtze River Delta[J]. Bulletin of the American Meteorological Society, 2019, 100 (1): 97-103 |
| [63] | Ren L W, Wang D Q, An N, et al. Anthropogenic influences on the persistent night-time heat wave in summer 2018 over Northeast China[J]. Bulletin of the American Meteorological Society, 2020, 101 (1): 83-87 |
| [64] | Sun Y, Dong S Y, Hu T, et al. Attribution of the warmest spring of 2018 in Northeastern Asia using simulations of a coupled and an atmospheric model[J]. Bulletin of the American Meteorological Society, 2019, 101 (1): 129-134 |
| [65] | Chao C Y, Guan X D, Li C, et al. Anthropogenic contribution to the unprecedented 2022 midsummer extreme high-temperature event in southern China[J]. Bulletin of the American Meteorological Society, 2024, 105 (1): 233-238 |
| [66] | Lu C H, Sun Y, Christidis N, et al. Contribution of global warming and atmospheric circulation to the hottest spring in eastern China in 2018[J]. Advances in Atmospheric Sciences, 2020, 37 (11): 1285-1294 |
| [67] | Wang D Q, Sun Y. Effects of anthropogenic forcing and atmospheric circulation on the record-breaking welt bulb heat event over southern China in September 2021[J]. Advances in Climate Change Research, 2022, 13 (6): 778-786 |
| [68] | Wang D Q, Sun Y, Hu T, et al. The 2022 record-breaking heat event over the middle and lower reaches of the Yangtze River[J]. Bulletin of the American Meteorological Society, 2024, 105 (1): 200-205 |
| [69] | Sun Y, Hu T, Zhang X B, et al. Anthropogenic influence on the eastern China 2016 super cold surge[J]. Bulletin of the American Meteorological Society, 2017, 99 (1): 123-127 |
| [70] | Qian C, Wang J, Dong S Y, et al. Human influence on the record-breaking cold event in January of 2016 in eastern China[J]. Bulletin of the American Meteorological Society, 2018, 99 (1): 118-122 |
| [71] | Chen Z F, Sun Y, Zhang X B, et al. Role of anthropogenic forcing and atmospheric circulation in a low-temperature event in February 2022 in eastern China[J]. Advances in Climate Change Research, 2023, 14 (6): 921-929 |
| [72] | Burke C, Stott P, Ciavarella A, et al. Attribution of extreme rainfall in Southeast China during May 2015[J]. Bulletin of the American Meteorological Society, 2016, 97 (12): 92-96 |
| [73] | Sun Q H, Miao C Y. Extreme rainfall (R20mm, RX5day) in Yangtze-Huai, China, in June-July 2016: the role of ENSO and anthropogenic climate change[J]. Bulletin of the American Meteorological Society, 2018, 99 (1): 102-106 |
| [74] | Yuan X, Wang S S, Hu Z Z. Do climate change and El Niño increase likelihood of Yangtze River extreme rain-fall?[J]. Bulletin of the American Meteorological Society, 2018, 99 (1): 113-117 |
| [75] | Zhou C L, Wang K C, Qi D. Attribution of the July 2016 extreme precipitation event over China’s Wuhan[J]. Bulletin of the American Meteorological Society, 2018, 99 (1): 107-112 |
| [76] | Li C X, Tian Q H, Yu R, et al. Attribution of extreme precipitation in the lower reaches of the Yangtze River during May 2016[J]. Environmental Research Letters, 2018, 13 (1): L014015 |
| [77] | Li R K, Li D L, Nanding N, et al. Anthropogenic influences on heavy precipitation during the 2019 extremely wet rainy season in southern China[J]. Bulletin of the American Meteorological Society, 2021, 102 (1): 103-109 |
| [78] | Zhou T J, Song F F, Lin R P, et al. The 2012 North China floods: explaining an extreme rainfall event in the context of a longer-term drying tendency[J]. Bulletin of the American Meteorological Society, 2013, 94 (9): 49-51 |
| [79] | Zhang W X, Li W, Zhu L H, et al. Anthropogenic influence on 2018 summer persistent heavy rainfall in central western China[J]. Bulletin of the American Meteorological Society, 2020, 101 (1): 65-70 |
| [80] | Tang H S, Wang Z Y, Tang B, et al. Reduced Probability of 2020 June-July persistent heavy Mei-yu rainfall event in the middle to lower reaches of the Yangtze River basin under anthropogenic forcing[J]. Bulletin of the American Meteorological Society, 2022, 103 (3): 83-89 |
| [81] | Lu C H, Sun Y, and Zhang X B. The 2020 record-breaking Mei-yu in the Yangtze River Valley of China: the role of anthropogenic forcing and atmospheric circulation[J]. Bulletin of the American Meteorological Society, 2022, 103 (3): 98-104 |
| [82] | Hu T, Sun Y, Zhang X B, et al. Anthropogenic influence on the 2021 wettest September in northern China[J]. Bulletin of the American Meteorological Society, 2023, 104 (1): 243-248 |
| [83] | Sheng B S, Dong B W, Wang H L, et al. Anthropogenic influences on extremely persistent seasonal precipitation in southern China during May-June 2022[J]. Bulletin of the American Meteorological Society, 2024, 105 (2): 425-431 |
| [84] | Liu X R, Jie H, Zou Y L, et al. Anthropogenic influence on 2022 June extreme rainfall over the Pearl River basin[J]. Bulletin of the American Meteorological Society, 2024, 105 (2): 418-424 |
| [85] | Hu Y M, Dong B W, Xie J H, et al. Anthropogenic influence on 2022 extreme January-February precipitation in southern China[J]. Bulletin of the American Meteorological Society, 2023, 104 (11): 1935-1940 |
| [86] | Wang Y M, Yuan X. Anthropogenic speeding up of South China flash droughts as exemplified by the 2019 summer-autumn transition season[J]. Geophysical Research Letters, 2020, 48 (9): e2020GL091901 |
| [87] | Wang S S, Huang J P, Yuan X. Attribution of 2019 extreme spring-early summer hot drought over Yunnan in southwestern China[J]. Bulletin of the American Meteorological Society, 2021, 102 (1): 91-96 |
| [88] | Zhang L X, Zhou T J, Zhang X, et al. Attribution of the extreme 2022 summer drought along the Yangtze River Valley in China based on detection and attribution system of Chinese Academy of Sciences[J]. Bulletin of the American Meteorological Society, 2024, 105 (7): 1062-1067 |
| [89] | Luo F, Wang S S, He Y L, et al. Anthropogenic warming has increased the 2020 extreme hot and dry conditions over Southwest China[J]. Bulletin of the American Meteorological Society, 2022, 103 (3): 124-129 |
| [90] | Li W, Jiang Z H, Li L. Anthropogenic influence on the record-breaking compound hot and dry event in summer 2022 in the Yangtze River basin in China[J]. Bulletin of the American Meteorological Society, 2023, 104 (11): 1928-1934 |
| [91] | Qian C, Ye Y B, Bevacqua E, et al. Human influences on spatially compounding flooding and heatwave events in China and future increasing risks[J]. Weather and Climate Extremes, 2023, 42: L100616 |
| [92] | Wang J, Chen Y, Tett S F B, et al. Storyline attribution of human influence on a record-breaking spatially compounding flood-heat event[J]. Science Advances, 2023, 9 (48): eadi2714 |
| [1] | 李慧慧, 齐明, 孙仁金. 气候转型金融标准的国际实践及中国路径[J]. 气候变化研究进展, 2025, 21(3): 428-439. |
| [2] | 石英, 徐影, 巢清尘, 张梦然, 韩振宇, 王荣. 基于CMIP6多模式的南水北调西线工程区未来气候变化预估[J]. 气候变化研究进展, 2025, 21(3): 340-352. |
| [3] | 陈思达, 刘凯, 李博浩, 汪明. 中国脱贫县破纪录极端天气事件研究[J]. 气候变化研究进展, 2025, 21(3): 327-339. |
| [4] | 张琴, 张利平, 李意, 刘丽娜, 佘敦先, 周芷菱, 袁喆. 气候水文预估不确定性量化及约束方法研究进展[J]. 气候变化研究进展, 2025, 21(3): 317-326. |
| [5] | 曲洋, 王铭铭, 周方卓, 黄俊灵, 常世彦. 基于气候因子框架的气候变化对能源系统的影响评估[J]. 气候变化研究进展, 2025, 21(3): 353-363. |
| [6] | 王英珊, 孙维君, 丁明虎, 刘伟刚, 杜文涛, 秦翔, 张东启. 青藏高原冰川物质平衡变化特征及其对气候变化响应的研究进展[J]. 气候变化研究进展, 2025, 21(2): 208-220. |
| [7] | 马丽娟, 袁佳双, 徐源. 气候临界点与我国气候安全新挑战[J]. 气候变化研究进展, 2025, 21(2): 273-287. |
| [8] | 车慧正, 张晓春, 王剑琼, 沈小静, 张根, 徐婉筠, 郑宇, 张小曳. 瓦里关30年大气本底观测研究回顾和展望[J]. 气候变化研究进展, 2025, 21(2): 186-197. |
| [9] | 孙守琴, 谢汶天, 胡兆永, 王文志, 王根绪. 亚高山森林树木生长响应气候变化研究的前沿和挑战[J]. 气候变化研究进展, 2025, 21(2): 198-207. |
| [10] | 秦卓凡, 廖宏, 代慧斌. 气候变化影响我国大气重污染事件的研究进展[J]. 气候变化研究进展, 2025, 21(1): 56-68. |
| [11] | 吕学都, 陈佳琪, 葛慧, 朱乙丹. 气候金融实践与发展建议[J]. 气候变化研究进展, 2025, 21(1): 78-90. |
| [12] | 袁宇锋, 廖圳, 周佰铨, 翟盘茂. 全球气候变暖加剧背景下中国高影响区域性极端事件及归因研究进展[J]. 气候变化研究进展, 2025, 21(1): 44-55. |
| [13] | 丁永建, 张世强, 陈仁升, 秦甲, 赵求东, 刘俊峰, 阳勇, 何晓波, 苌亚平, 上官冬辉, 韩添丁, 吴锦奎, 李向应. 气候变化对冰冻圈水文影响研究综述[J]. 气候变化研究进展, 2025, 21(1): 1-21. |
| [14] | 陈德亮, 谭显春, 彭喆, 闫洪硕, 程永龙. 人工智能在气候研究和服务中的机遇与挑战[J]. 气候变化研究进展, 2024, 20(6): 669-681. |
| [15] | 高翔. 国际条约下的气候资金问题辨析[J]. 气候变化研究进展, 2024, 20(6): 799-807. |
| 阅读次数 | ||||||
|
全文 |
|
|||||
|
摘要 |
|
|||||