Climate Change Research ›› 2023, Vol. 19 ›› Issue (3): 347-356.doi: 10.12006/j.issn.1673-1719.2022.183
• Greenhouse Gas Emissions • Previous Articles Next Articles
Analysis of carbon emission level and intensity of China’s transportation industry and different transportation modes
TIAN Pei-Ning1,2( ), MAO Bao-Hua1,2(), TONG Rui-Yong1,2, ZHANG Hao-Xiang3, ZHOU Qi1,2
- 1 Intergrated Transport Research Center of China, Beijing Jiaotong University, Beijing 100044, China
2 Key Laboratory of Transport Industry of Big Data Application Technologics for Comprehensive Transport, Beijing 100044, China
3 Beijing Urban Construction Design and Development Group Co., Ltd., Beijing 100037, China
-
Received:2022-08-01Revised:2022-10-22Online:2023-05-30Published:2023-02-13
Cite this article
TIAN Pei-Ning, MAO Bao-Hua, TONG Rui-Yong, ZHANG Hao-Xiang, ZHOU Qi. Analysis of carbon emission level and intensity of China’s transportation industry and different transportation modes[J]. Climate Change Research, 2023, 19(3): 347-356.
share this article
Add to citation manager EndNote|Ris|BibTeX
URL: http://www.climatechange.cn/EN/10.12006/j.issn.1673-1719.2022.183
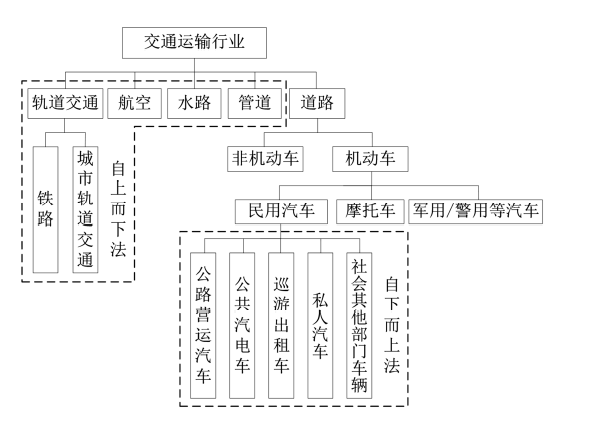
Fig. 1 Framework diagram of the transportation industry
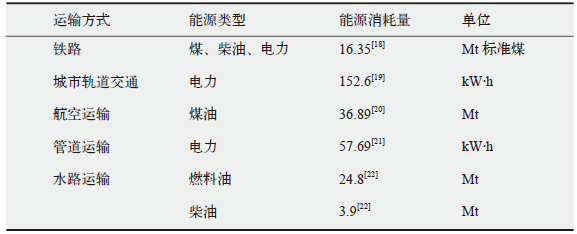 |
Table 1 Energy consumption by mode of transport in 2019
| |
 |
Table 2 Activity level of all types of vehicles in road transport in 2019
| |
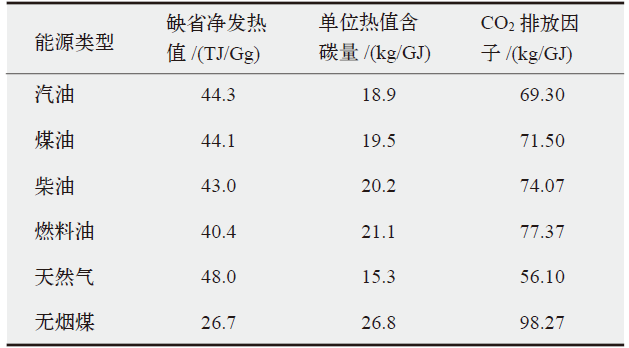 |
Table 3 Values of the relevant parameters for carbon emission factors[17,33]
| |

Fig. 2 CO2 emissions from the transportation industry and different modes of transportation in 2019
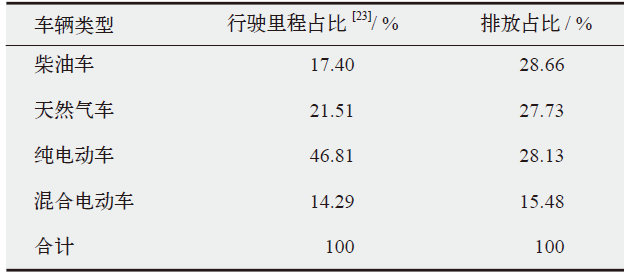 |
Table 4 Carbon emissions and vehicle type share of public vehicles and trams in 2019
| |
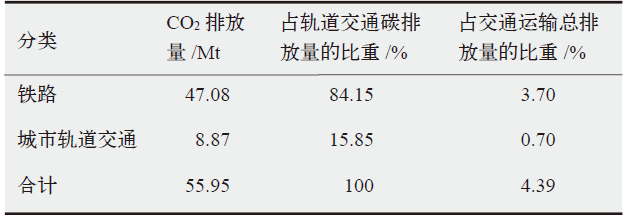 |
Table 5 Carbon emissions and composition of rail transit in 2019
| |
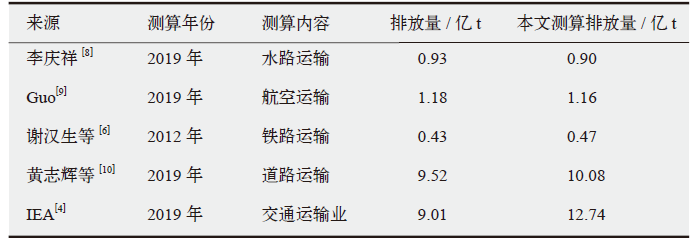 |
Table 6 Comparison with established literature results
| |

Fig. 3 Transportation carbon emissions and their share in the top 25 countries in 2019 [35]
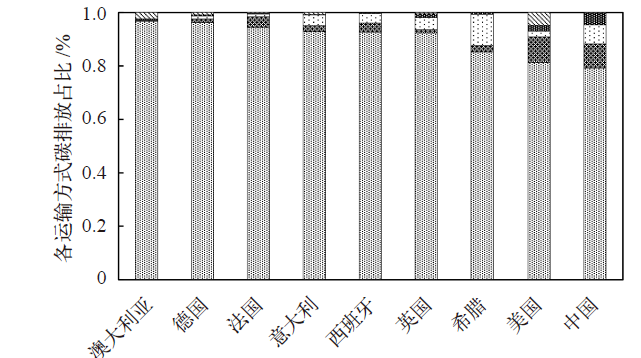
Fig. 4 Structure of carbon emissions from the transport sector in China, the United States in 2019 and selected European countries in 2018
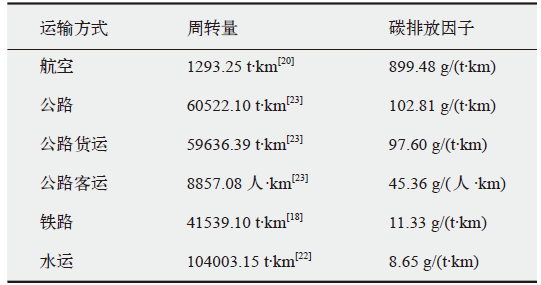 |
Table 7 Calculation of carbon emission factors per unit of turnover for different modes of transport in 2019
| |
| [1] | IPCC. Global warming of 1.5℃ [R/OL]. 2018 [2022-10-20]. https://www.ipcc.ch/sr15/ |
| [2] | Hale T, Hsu A, Kuramochi T, et al. Net zero tracker [DB/OL]. 2022 [2022-10-20]. https://zerotracker.net/ |
| [3] | 李晓易, 吴睿. 交通运输温室气体核算边界和测算方法研究[J]. 气候变化研究进展, 2023, 19 (1): 84-90. |
| Li X Y, Wu R. Research on greenhouse gas emissions accounting boundaries and calculating method of the transport sector[J]. Climate Change Research, 2023, 19 (1): 84-90 (in Chinese) | |
| [4] | International Energy Agency (IEA). China key energy statiostics, 2020 [DB/OL]. 2022 [2022-10-20]. https://www.iea.org/countries/china |
| [5] | 贾顺平, 毛保华, 刘爽, 等. 中国交通运输能源消耗水平测算与分析[J]. 交通运输系统工程与信息, 2010, 10 (1): 22-27. |
| Jia S P, Mao B H, Liu S, et al. Calculation and analysis of transportation energy consumption level in China[J]. Journal of Transportation Systems Engineering and Information Technology, 2010, 10 (1): 22-27 (in Chinese) | |
| [6] | 谢汉生, 周新军, 黄茵, 等. 铁路运营碳排放测算及低碳效应评价研究[J]. 铁道工程学报, 2014 (3): 117-122. |
| Xie H S, Zhou X J, Huang Y, et al. Research on the measurement of carbon emission from railway operation and evaluation of low-carbon effect[J]. Journal of Railway Engineering Society, 2014 (3): 117-122 (in Chinese) | |
| [7] | 汪莹, 高佳钰, 雷雨轩. 我国铁路运营碳排放影响因素研究[J]. 铁道学报, 2020, 42 (4): 7-16. |
| Wang Y, Gao J Y, Lei Y X. A research of influence factors on carbon emission of railway in China[J]. Journal of The China Railway Society, 2020, 42 (4): 7-16 (in Chinese) | |
| [8] | 李庆祥. 我国水路运输碳排放现状及减碳路径分析[J]. 交通节能与环保, 2021, 17 (2): 1-4, 12. |
| Li Q X. Carbon emission status and carbon reduction path analysis of waterway transport in China[J]. Transport Energy Conservation & Environmental Protection, 2021, 17 (2): 1-4, 12 (in Chinese) | |
| [9] | Guo Y D. Analysis on emission reduction strategies of Chinese airlines under the dual carbon goals[J]. Journal of Global Economy, Business and Finance, 2022, 4 (2): 63-66 |
| [10] | 黄志辉, 纪亮, 尹洁, 等. 中国道路交通二氧化碳排放达峰路径研究[J]. 环境科学研究, 2022, 35 (2): 385-393. |
| Huang Z H, Ji L, Yin J, et al. Peak pathway of China’s road traffic carbon emissions[J]. Research of Environmental Sciences, 2022, 35 (2): 385-393 (in Chinese) | |
| [11] | 周琪, 梁肖, 黄俊生, 等. 城市轨道交通碳排放效率与影响因素研究[J/OL]. 交通运输系统工程与信息, 2022 [2023-01-14]. http://kns.cnki.net/kcms/detail/11.4520.U.20220930.1213.004.html. |
| Zhou Q, Liang X, Huang J S, et al. Carbon emission efficiency and influencing factors analysis of urban rail transit[J/OL]. Journal of Transportation Systems Engineering and Information Technology, 2022 [2023-01-14]. http://kns.cnki.net/kcms/detail/11.4520.U.20220930.1213.004.html (in Chinese) | |
| [12] |
Cifuentes F, González C M, Trejos E M, et al. Comparison of top-down and bottom-up road transport emissions through high-resolution air quality modeling in a city of complex orography[J]. Atmosphere, 2021, 12 (11): 1372
doi: 10.3390/atmos12111372 URL |
| [13] | Annadanam S K, Kota S H. Emission of greenhouse gases and criteria pollutants from railways in India estimated using a modified top-down approach[J]. Journal of Cleaner Production, 2018: 610-617 |
| [14] | Alam M S, Duffy P, Hyde B, et al. Improvement in the estimation and back-extrapolation of CO2 emissions from the Irish road transport sector using a bottom-up data modelling approach[J]. Transportation Research Part D, 2017: 18-32 |
| [15] | Fu M, Kelly J A, J Clinch P. Estimating annual average daily traffic and transport emissions for a national road network: a bottom-up methodology for both nationally-aggregated and spatially-disaggregated results[J]. Journal of Transport Geography, 2017: 186-195 |
| [16] | Wu T Y, Ng S T, Chen J. Deciphering the CO2 emissions and emission intensity of cement sector in China through decomposition analysis[J]. Journal of Cleaner Production, 2022: 352 |
| [17] | IPCC. IPCC 2006 guidelines for national greenhouse gas inventories [R/OL]. 2006 [2022-08-01]. https://www.ipcc.ch/report/2006-ipcc-guidelines-for-national-greenhouse-gas-inventories/ |
| [18] | 国家铁路局. 2019年铁道统计公报[R/OL]. 2020 [2022-10-20]. http://www.nra.gov.cn/xwzx/zlzx/hytj/202204/P020220902306747176052.pdf. |
| National Railway Administration of The People’s Republic of China. Railways statistical bulletin 2019 [R/OL]. 2020 [2022-10-20]. http://www.nra.gov.cn/xwzx/zlzx/hytj/202204/P020220902306747176052.pdf (in Chinese) | |
| [19] | 中国城市轨道交通协会. 城市轨道交通2019年度统计和分析报告 [R/OL]. 2020 [2022-10-20]. https://www.camet.org.cn/tjxx/5133. |
| China Association of Metros. Urban rail transit annual statistics and analysis report 2019 [R/OL]. 2020 [2022-10-20]. https://www.camet.org.cn/tjxx/5133 (in Chinese) | |
| [20] | 中国民用航空局发展计划司. 从统计看民航2020 [M]. 北京: 中国民航出版社, 2021: 114. |
| Civil Aviation Administration of China. Civil aviation in statistical terms 2020 [M]. Beijing: China Civil Aviation Publishing House, 2021: 114 (in Chinese) | |
| [21] | 中国电力企业联合会. 行业统计分析 [DB/OL]. 2020 [2022-10-20]. https://cec.org.cn/index.html. |
| China Electricity Council. Statistical analysis of the industry [EB/OL]. 2020 [2022-10-20]. https://cec.org.cn/index.html (in Chinese) | |
| [22] | 王庆一. 2020能源数据 [R/OL]. 2020 [2022-10-20]. https://www.efchina.org/Reports-zh/report-lceg-20210430-3-zh. |
| Wang Q Y. 2020 energy data [R/OL]. 2020 [2022-10-20]. https://www.efchina.org/Reports-zh/report-lceg-20210430-3-zh (in Chinese) | |
| [23] | 交通运输部. 2019年交通运输行业发展统计公报[J]. 交通财会, 2020 (6): 86-91. |
| Ministry of Transport of The People’s Republic of China. Statistical bulletin on the development of The transport sector in 2019[J]. Finance & Accounting for Transport, 2020 (6): 86-91 (in Chinese) | |
| [24] | 清华大学. 道路机动车排放清单编制技术指南(试行)[R/OL]. 2014 [2022-10-20]. https://www.mee.gov.cn/gkml/hbb/bgth/201407/W020140708387895271474.pdf. |
| Tsinghua University. Technical guide for the development of road motor vehicle emission inventories (trial) [R/OL]. 2014 [2022-10-20]. https://www.mee.gov.cn/gkml/hbb/bgth/201407/W020140708387895271474.pdf (in Chinese) | |
| [25] | 湖南省人民政府. 2020年长沙全部使用新能源公交车[EB/OL]. 2017 [2022-10-20]. http://www.hunan.gov.cn/hnyw/szdt/201705/t20170523_4810282.html. |
| People’s Government of Hunan Province. All new energy buses to be used in Changsha by 2020 [EB/OL]. 2017 [2022-10-20]. http://www.hunan.gov.cn/hnyw/szdt/201705/t20170523_4810282.html (in Chinese) | |
| [26] | 长安大学. 2019中国公路货运大数据报告[R/OL]. 2020 [2022-10-20]. https://max.book118.com/html/2020/0408/6202044142002153.shtm. |
| Chang’an University. 2019 China road freight big data report [R/OL]. 2020 [2022-10-20]. https://max.book118.com/html/2020/0408/6202044142002153.shtm (in Chinese) | |
| [27] | 国家能源局. 经济又环保江西省多地运营天然气公交车 [EB/OL]. 2012 [2022-10-19]. http://www.nea.gov.cn/2012-10/19/c_131915953.htm. |
| National Energy Administration. Economical and environmentally friendly natural gas buses operating in many parts of Jiangxi Province [EB/OL]. 2012 [2022-10-19]. http://www.nea.gov.cn/2012-10/19/c_131915953.htm (in Chinese) | |
| [28] | 滕欣余, 张钰. 2019年新能源公交客车运行大数据研究报告 [R/OL]. 2019 [2022-10-20]. https://www.doc88.com/p-9993922908077.html. |
| Teng X Y, Zhang Y. 2019 new energy bus operation big data research report [R/OL]. 2019 [2022-10-20]. https://www.doc88.com/p-9993922908077.html (in Chinese) | |
| [29] | 北京交通发展研究院. 北京交通发展年度报告(2020) [R/OL]. 2020 [2022-10-20]. https://www.bjtrc.org.cn/List/index/cid/7.html. |
| Beijing Transport Institute. Beijing transport development annual report (2020) [R/OL]. 2020 [2022-10-20]. https://www.bjtrc.org.cn/List/index/cid/7.html (in Chinese) | |
| [30] | 中华人民共和国工业和信息化部. 2019年度中国乘用车企业平均燃料消耗量与新能源汽车积分情况公告[R/OL]. 2020 [2022-10-20]. https://ythxxfb.miit.gov.cn/ythzxfwpt/hlwmh/zcwj/xzxk/clsczr/art/2020/art_a14a402f2b5b4ac6addad2998f845fd0.html. |
| Ministry of Industry and Information Technology of The People’s Republic of China. Announcement of average fuel consumption and new energy vehicle credits of Chinese passenger vehicle enterprises for 2019 [R/OL]. 2020 [2022-10-20]. https://ythxxfb.miit.gov.cn/ythzxfwpt/hlwmh/zcwj/xzxk/clsczr/art/2020/art_a14a402f2b5b4ac6addad2998f845fd0.html (in Chinese) | |
| [31] | 国家数据. 年度数据: 私人汽车拥有量[DB/OL]. 2020 [2022-10-15]. https://data.stats.gov.cn/easyquery.htm?cn=C01. |
| National Data. Annual data: private car ownership [DB/OL]. 2020 [2022-10-15]. https://data.stats.gov.cn/easyquery.htm?cn=C01 (in Chinese) | |
| [32] |
Ou S Q, Yu R J, Lin Z H, et al. Intensity and daily pattern of passenger vehicle use by region and class in China: estimation and implications for energy use and electrification[J]. Mitigation and Adaptation Strategies for Global Change, 2019, 25 (3): 307-327
doi: 10.1007/s11027-019-09887-0 |
| [33] | IPCC. 2019 refinement to the 2006 IPCC guidelines for national greenhouse gas inventories [R/OL]. 2006 [2022-7-20]. https://www.ipcc.ch/report/2019-refinement-to-the-2006-ipcc-guidelines-for-national-greenhouse-gas-inventories/ |
| [34] | 中华人民共和国生态环境部. 关于做好2022年企业温室气体排放报告管理相关重点工作的通知 [EB/OL]. 2022 [2022-10-20]. https://www.mee.gov.cn/xxgk2018/xxgk/xxgk06/202203/t20220315_971468.html. |
| Ministry of Ecology and Environment of The People’s Republic of China. Notice on the key tasks related to the management of corporate greenhouse gas emissions reporting in 2022 [EB/OL]. 2022 [2022-10-20]. https://www.mee.gov.cn/xxgk2018/xxgk/xxgk06/202203/t20220315_971468.html (in Chinese) | |
| [35] | Emissions Database for Global Atmospheric Research. Emissions database for global atmospheric research: fossil CO2 booklet 2020 [DB/OL]. 2020 [2022-10-20]. https://edgar.jrc.ec.europa.eu/report_2020 |
| [36] | United States Environmental Protection Agency. Inventory of U. S. greenhouse gas emissions and sinks 1990-2019 [DB/OL]. 2021 [2022-10-20]. https://www.epa.gov/ghgemissions/inventory-us-greenhouse-gas-emissions-and-sinks-1990-2019 |
| [37] | European Environment Agency. EEA greenhouse gases: data viewer [DB/OL]. 2021 [2022-10-18]. https://www.eea.europa.eu/data-and-maps/data/data-viewers/greenhouse-gases-viewer |
| [1] | XU Tian-Hao, HU Shan, YANG Zi-Yi, JIANG Yi. Carbon emission comparisons of the building sector between China and Sweden and its implication for achieving carbon neutrality in the building sector of China [J]. Climate Change Research, 2023, 19(3): 305-319. |
| [2] | LI Dan-Yang, CHEN Wen-Ying. Global transportation energy transition pathways towards carbon neutrality [J]. Climate Change Research, 2023, 19(2): 203-212. |
| [3] | YANG Shan-Shan, GUO Hao, YANG Xiu, LI Zheng. Consideration and prospect of total carbon emission control system under the double carbon target [J]. Climate Change Research, 2023, 19(2): 191-202. |
| [4] | FAN Xing, LI Lu, QIN Yuan-Yuan, GAO Xiang. The pathway from carbon peak to carbon neutrality in major developed economies and its insights [J]. Climate Change Research, 2023, 19(1): 102-115. |
| [5] | LI Pin, XIE Xiao-Min, HUANG Zhen. The process of Germany energiewende and its enlightenment to China [J]. Climate Change Research, 2023, 19(1): 116-126. |
| [6] | GUO Si-Yue, GENG Yong. Interpretation of IPCC AR6 on mitigation in industry [J]. Climate Change Research, 2022, 18(5): 574-579. |
| [7] | BAI Quan, HU Shan, GU Li-Jing. Interpretation of IPCC AR6 on buildings [J]. Climate Change Research, 2022, 18(5): 557-566. |
| [8] | YAN Shu-Qi, LI Su-Mei, LYU He, CHEN Sha, LIU Ying-Ying, WANG Hong-Tao, LIU Hui-Zheng, CHEN Qian-Li. Water footprint analysis of electricity production in Xinjiang Uygur Autonomous Region based on a hybrid LCA model and its changes under carbon neutralization target [J]. Climate Change Research, 2022, 18(3): 294-304. |
| [9] | ZENG An, TAN Xian-Chun, WANG Yi, GAO Jin-Xin. International experiences on Measurement, Reporting and Verification of climate finance and implications for China [J]. Climate Change Research, 2022, 18(2): 215-229. |
| [10] | ZHANG Hao-Nan, SHEN Rong-Rong, ZHANG Xing-Ping, KANG Jun-Jie, YUAN Jia-Hai. Implications and pathways of China's carbon neutrality: a review [J]. Climate Change Research, 2022, 18(2): 240-252. |
| [11] | REN Jia-Xue, GAO Qing-Xian, CHEN Hai-Tao, MENG Dan, ZHANG Yang, MA Zhan-Yun, LIU Qian, TANG Jia-Jie. Simulation research on greenhouse gas emissions from wastewater treatment plants under the vision of carbon neutrality [J]. Climate Change Research, 2021, 17(4): 410-419. |
| [12] | JIANG Ke-Jun, FENG Sheng-Bo. Going to the mitigation targets in Paris Agreement: the world is on the road [J]. Climate Change Research, 2021, 17(1): 1-6. |
| [13] | ZHANG Ya-Xin, LUO Hui-Lin, WANG Can. Progress and trends of global carbon neutrality pledges [J]. Climate Change Research, 2021, 17(1): 88-97. |
| [14] | Chang Shasha, Xi Fengming, Bi Lei, Chen Jian, Wang Jiaoyue, Wang Li . The Carbon Emission Baseline from Heating Industry—A Case Study in Shenyang City [J]. Climate Change Research, 2016, 12(6): 554-560. |
| Viewed | ||||||
|
Full text |
|
|||||
|
Abstract |
|
|||||