气候变化研究进展 ›› 2025, Vol. 21 ›› Issue (5): 671-683.doi: 10.12006/j.issn.1673-1719.2025.012
人类活动对中国东部极端热暴露事件的影响
罗皓月1, 孙颖2( ), 张玉霞2
- 1
重庆市气象服务中心, 401147 重庆
2气候系统预测与变化应对全国重点实验室/中国气象局气候预测研究重点开放实验室/国家气候中心, 100081 北京
-
收稿日期:2025-01-13修回日期:2025-04-28出版日期:2025-09-30发布日期:2025-09-05 -
通讯作者:孙颖,女,研究员,sunying@cma.gov.cn -
作者简介:罗皓月,女,助理工程师 -
基金资助:国家自然科学基金(42025503);国家自然科学基金(U2342228);中国气象局重点创新团队“气候变化检测与应对”(CMA2022ZD03)
The influence of human activities on extreme heat exposure events in eastern China
LUO Hao-Yue1, SUN Ying2(), ZHANG Yu-Xia2
- 1
Chongqing Meteorological Service Centre Chongqing 401147, China
2State Key Laboratory of Climate System Prediction and Risk Management/China Meteorological Administration Climate Studies Key Laboratory/National Climate Centre ,China Meteorological Administration Beijing 100081, China
-
Received:2025-01-13Revised:2025-04-28Online:2025-09-30Published:2025-09-05
摘要:
人口暴露度是衡量地区或国家面对极端天气气候事件风险的重要指标。虽然已有大量关于极端高温事件的归因工作,但关于人类活动对极端热暴露影响的研究仍很匮乏。本文基于国际耦合模式比较计划第6阶段(CMIP6)数据和全球网格化人口数据(GlobPoP),以破纪录的2022年中国极端热暴露事件为例,将事件归因框架从事件本身拓展到事件影响层面,提出了人类活动影响极端热暴露事件的归因方法。以日最高气温超过35℃和40℃阈值定义的极端高温和人口暴露度(Tx35E和Tx40E)为指标,发现1990—2022年中国极端高温日数和极端热暴露持续增加,东部增长趋势最明显。偏差订正后CMIP6多模式归因分析表明,人类活动增加了类似中国东部2022年极端热暴露事件发生概率,使长江以南和长江以北初夏35℃极端热暴露事件的发生概率分别增加了1.4倍和2.4倍。人类活动还增加了极端热暴露度和暴露比例。盛夏高温日数越多,人类活动对热暴露度值和暴露比例的影响越明显。长江以南和长江以北分别有3.2%(46.5×10⁶人∙d)和1.2%(17.9×10⁶人∙d)的总人口因人类活动而额外暴露于盛夏35℃以上的极端高温中。对于Tx40E,虽然长江以南和长江以北40℃以上的极端高温事件较少,但人类活动仍加剧了热暴露事件的发生概率,并带来了额外的极端热暴露。
引用本文
罗皓月, 孙颖, 张玉霞. 人类活动对中国东部极端热暴露事件的影响[J]. 气候变化研究进展, 2025, 21(5): 671-683.
LUO Hao-Yue, SUN Ying, ZHANG Yu-Xia. The influence of human activities on extreme heat exposure events in eastern China[J]. Climate Change Research, 2025, 21(5): 671-683.
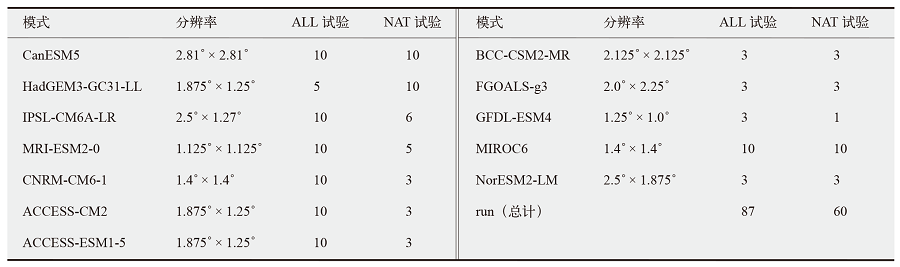 |
表1 本文使用的CMIP6模式
Table 1 The CMIP6 models used in this study
| |
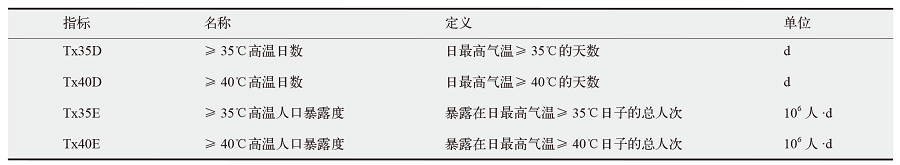 |
表2 极端高温和热暴露指标
Table 2 Extreme heat and heat exposure indicators
| |
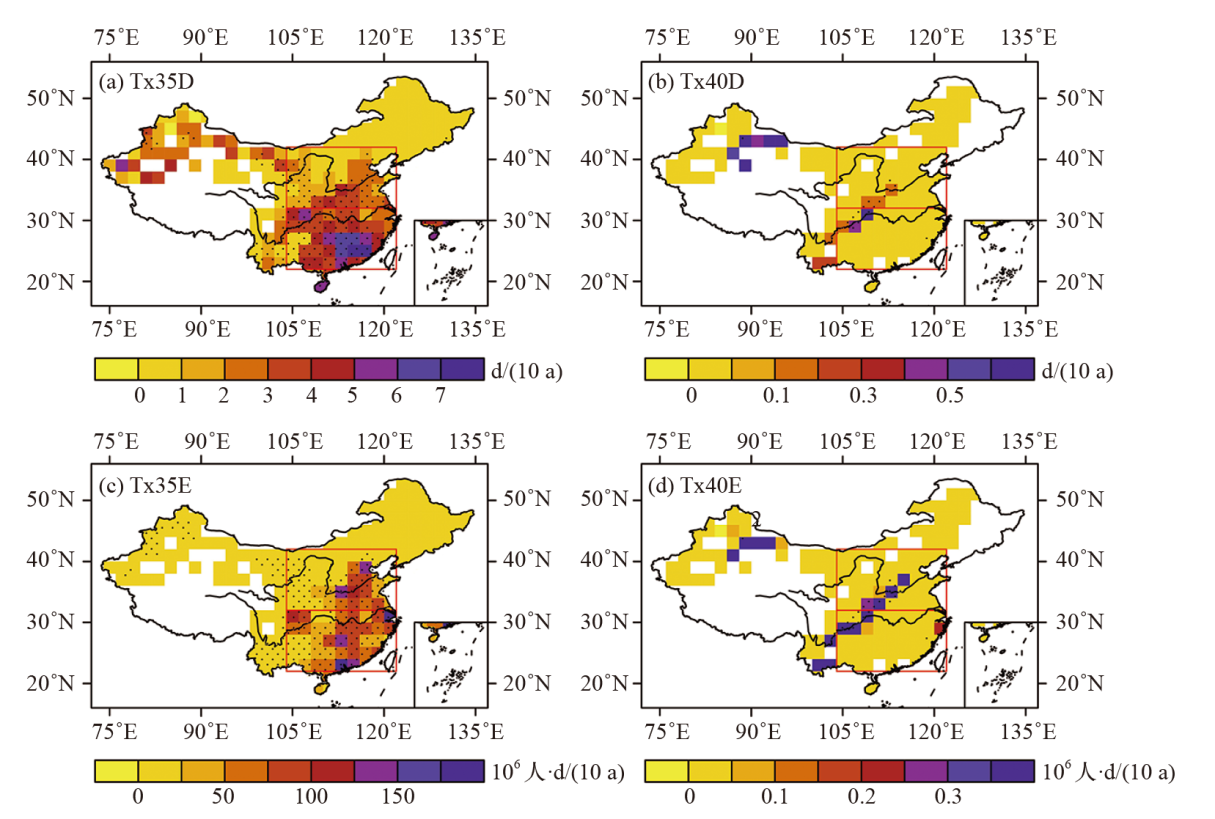
图1 1990—2022年5—8月中国Tx35D (a)、Tx40D (b)、Tx35E (c)和Tx40E (d)线性趋势的空间分布 注:图中打点区域通过0.05水平的显著性检验,红色方框标注了东部区域(长江以南和长江以北)。
Fig. 1 Spatial distribution of linear trends for Tx35D (a), Tx40D (b), Tx35E (c), and Tx40E (d) in China from May to August during 1990-2022
图2 1990—2022年5—8月中国东部区域平均人口(a)、Tx35D (b)、Tx35E (c)、Tx40D (d)和Tx40E (e)的距平时间序列(相对于1995—2014年) 注:五角星代表最大值出现的年份。
Fig. 2 Changes of population (a), Tx35D (b), Tx35E (c), Tx40D (d), and Tx40E (e) in eastern China from May to August during 1990-2022 (relative to 1995-2014)
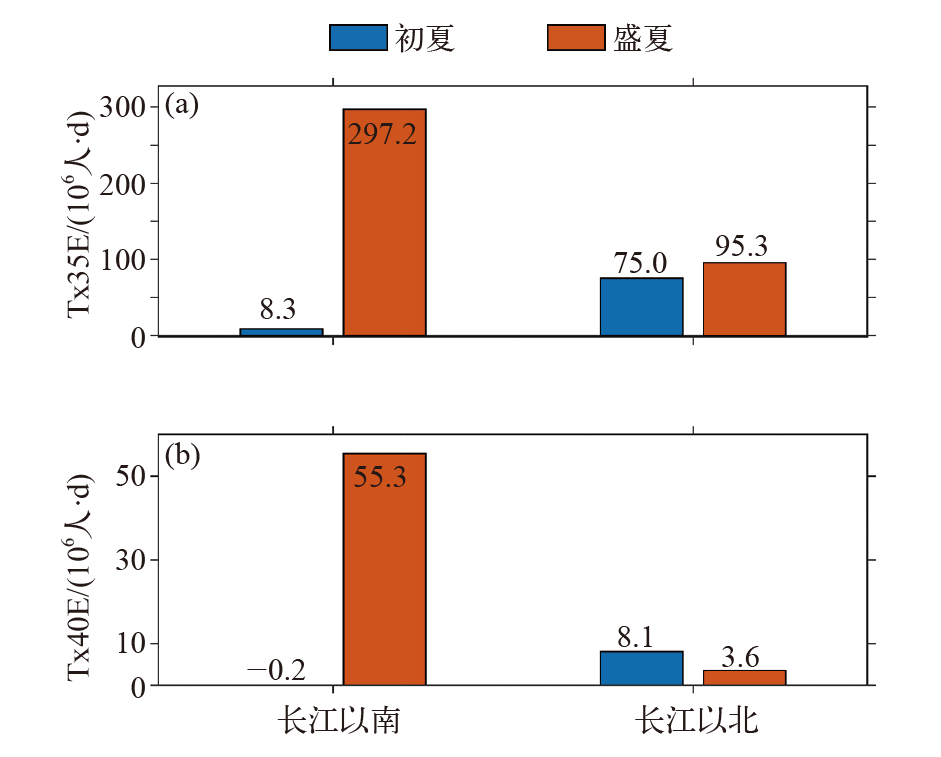
图3 2022年长江以南和长江以北初夏和盛夏Tx35E (a)和Tx40E (b)的观测值(相对于1995—2014年)
Fig. 3 Observed 2022 anomalies of Tx35E (a) and Tx40E (b) for early summer and summer in the south and north of the Yangtze River (relative to 1995-2014)
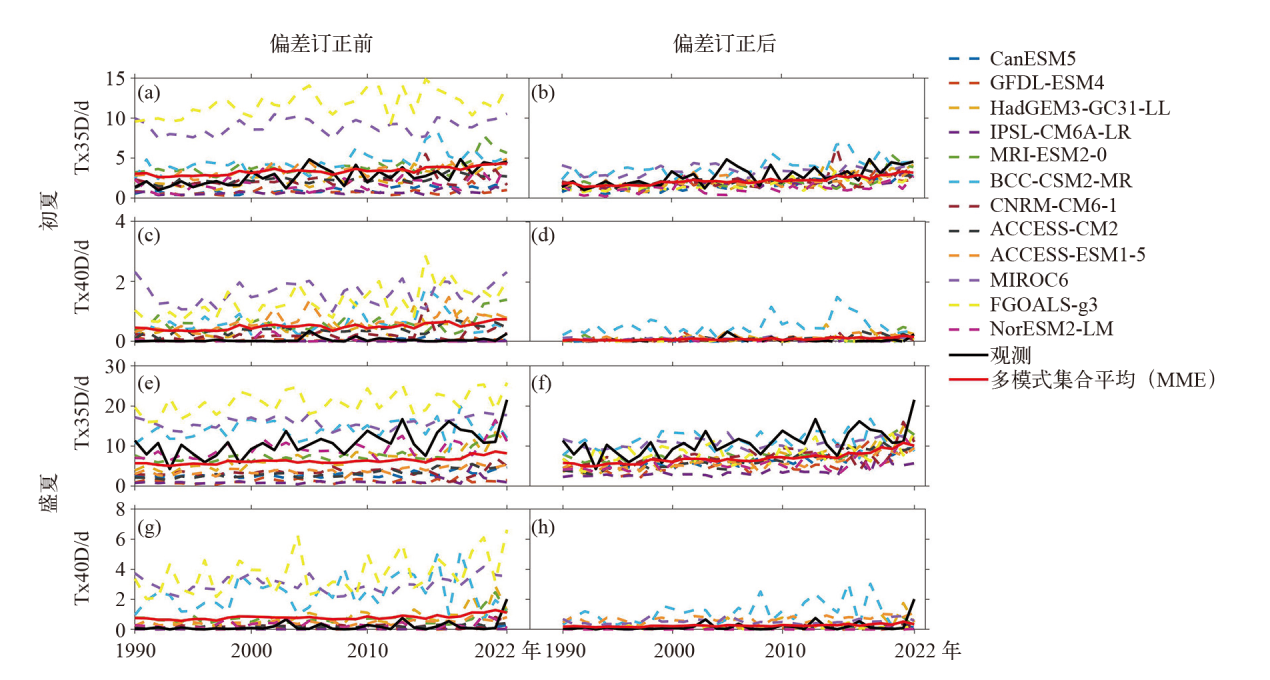
图4 模式偏差订正前后,1990—2022年中国东部初夏和盛夏Tx35D(a,b,e,f)和Tx40D(c,d,g,h)的原始序列
Fig. 4 Original time series of Tx35D (a, b, e, f) and Tx40D (c, d, g, h) for early summer and summer in eastern China from 1990 to 2022, before and after bias correction
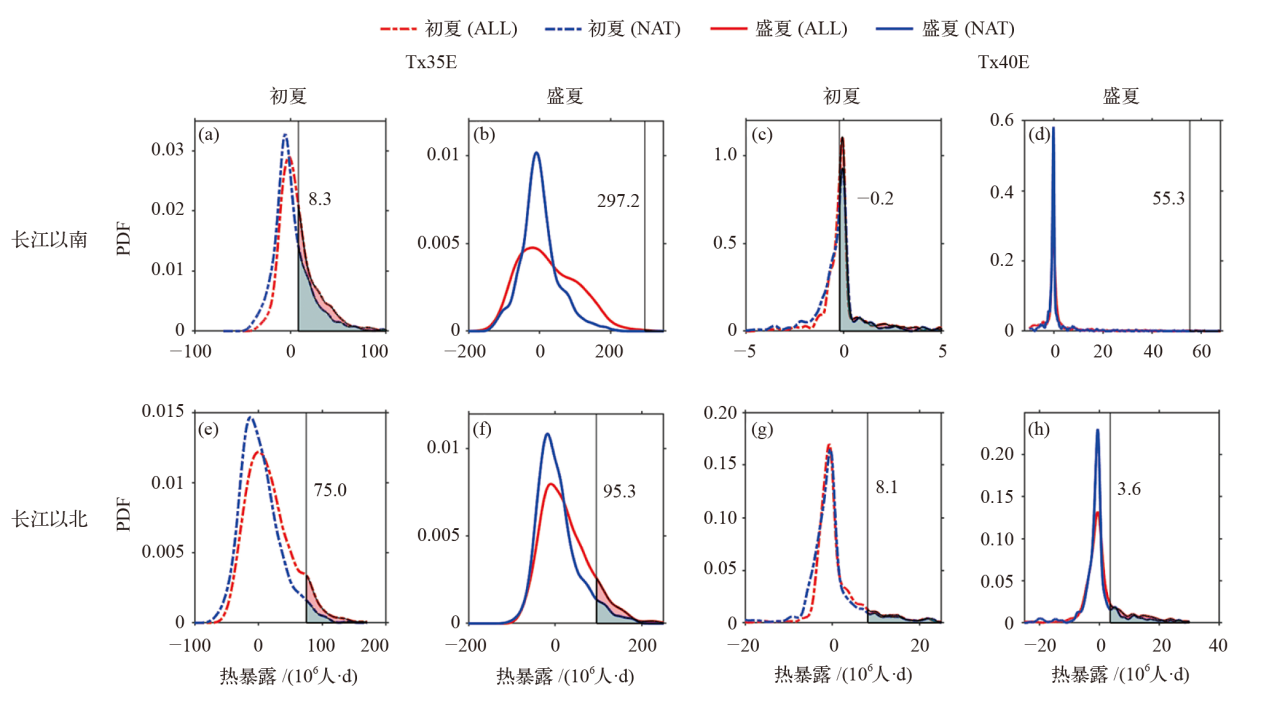
图5 盛夏和初夏长江以南和长江以北Tx35E(a,b,e,f)和Tx40E(c,d,g,h)在ALL和NAT强迫下的概率密度分布(相对于1995—2014年) 注:垂直线条表示2022年事件的观测值。
Fig. 5 Probability density distributions of Tx35E (a, b, e, f) and Tx40E (c, d, g, h) for early summer and summer in the south and north of the Yangtze River, under ALL and NAT forcing (relative to 1995-2014)
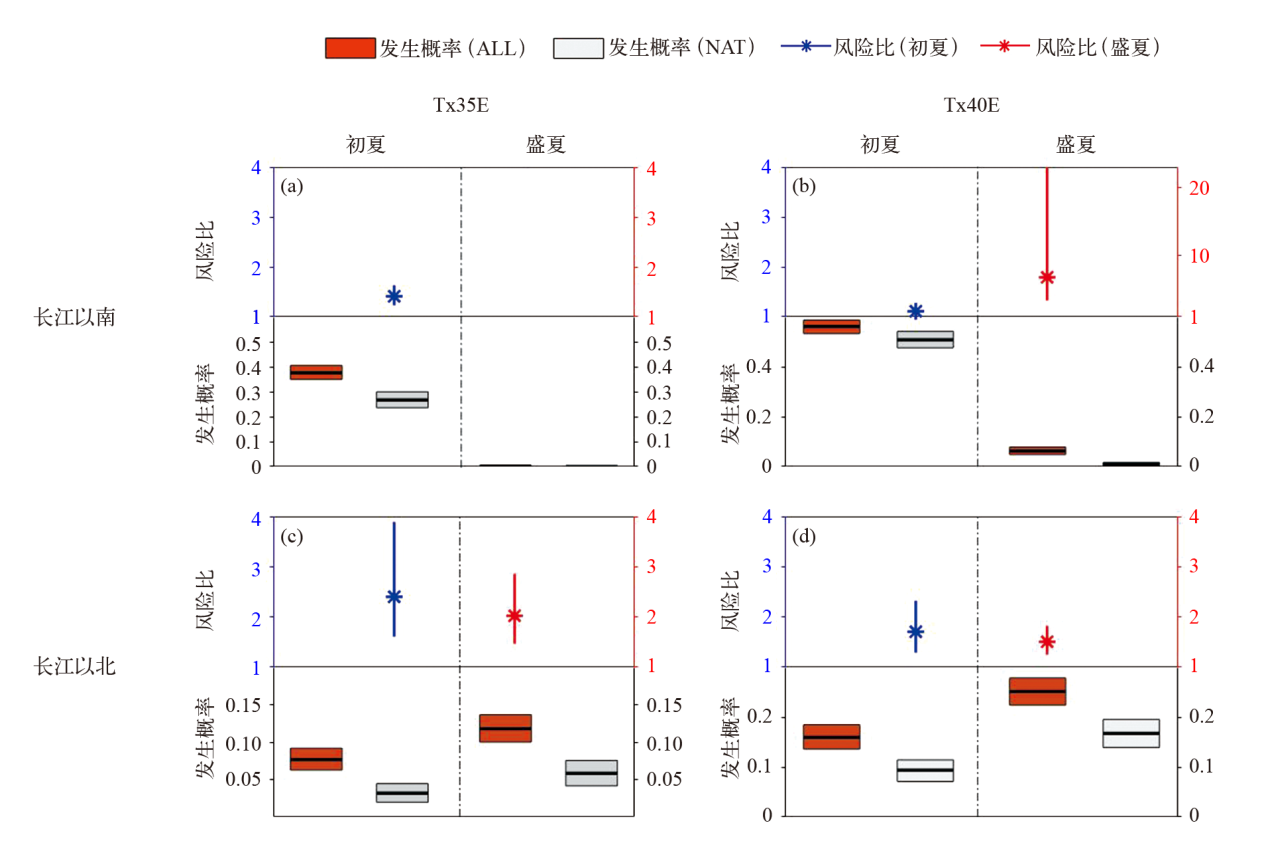
图6 不同强迫下2022年长江以南和长江以北初夏和盛夏极端热暴露事件Tx35E(a,c)和Tx40E(b,d)的发生概率与风险比及其95%不确定性区间
Fig. 6 Risk ratio, probability, and their 95% uncertainty intervals for extreme heat exposure events Tx35E (a, c) and Tx40E (b, d) in early summer and summer of 2022 in the south and north of the Yangtze River
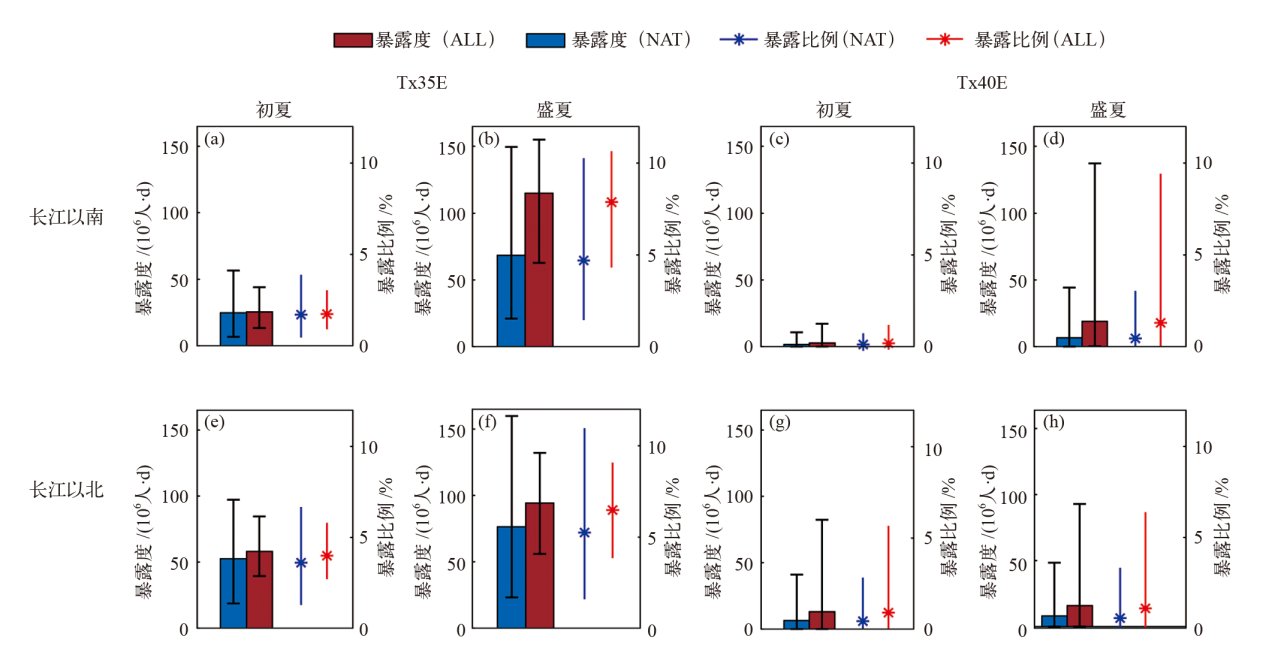
图7 不同强迫下Tx35E(a,b,e,f)和Tx40E(c,d,g,h)热暴露值和人口暴露比例 注:CMIP6多模式集合平均结果,垂直线条表示模式5%~95%百分位值。
Fig. 7 Heat exposure and exposure ratio under different forcings for Tx35E (a, b, e, f) and Tx40E (c, d, g, h). (CMIP6 multi-model ensemble mean, vertical lines represent the 5%?95% model percentile range)
| [1] | Dunn R J H, Alexander L V, Donat M G, et al. Development of an updated global land in situ-based data set of temperature and precipitation extremes: HadEX3[J]. Journal of Geophysical Research: Atmospheres, 2020, 125: e2019JD032263 |
| [2] | Zhang P F, Ren G Y, Xu Y, et al. Observed changes in extreme temperature over the global land based on a newly developed station daily dataset[J]. Journal of Climate, 2019, 32 (24): 8489-8509 |
| [3] | 尹红, 孙颖. 基于ETCCDI指数2017年中国极端温度和降水特征分析[J]. 气候变化研究进展, 2019, 15 (4): 363-373. |
| Yin H, Sun Y. Characteristics of extreme temperature and precipitation in China in 2017 based on ETCCDI indices[J]. Climate Change Research, 2019, 15 (4): 363-373 (in Chinese) | |
| [4] | Qian C, Zhang X B, Li Z. Linear trends in temperature extremes in China, with an emphasis on non-Gaussian and serially dependent characteristics[J]. Climate Dynamics, 2018, 53 (1-2): 533-550 |
| [5] | IPCC. Climate change: the physical science basis[M]. Cambridge: Cambridge University Press, 2021 |
| [6] | Stott P A, Christidis N, Otto F E L, et al. Attribution of extreme weather and climate-related events[J]. WIREs Climate Change, 2016, 7: 23-41 |
| [7] | Sun Y, Zhang X B, Ding Y H, et al. Understanding human influence on climate change in China[J]. National Science Review, 2021, 9 (3): nwab113 |
| [8] | Peterson T C, Stott P A, Herring S. Explaining extreme events of 2011 from a climate perspective[J]. Bulletin of the American Meteorological Society, 2012, 93 (7): 1041-1067 |
| [9] | Knutson T, Kossin J P, Mears C, et al. Detection and attribution of climate change. In: climate science special report: fourth national climate assessment[R]. USA: U.S. Global Change Research Program, 2017 |
| [10] | Stott P A, Stone D A, Allen M R. Human contribution to the European heatwave of 2003[J]. Nature, 2004, 432: 610-614 |
| [11] | Allen M. Liability for climate change[J]. Nature, 2003, 421 (6926): 891-892 |
| [12] | Peterson T C, Hoerling M P, Stott P A, et al. Explaining extreme events of 2012 from a climate perspective[J]. Bulletin of the American Meteorological Society, 2013, 94 (9): 1-74 |
| [13] | Christidis N, Stott P A, Scaife A A, et al. A new HadGEM3-A-Based system for attribution of weather- and climate-related extreme events[J]. Journal of Climate, 2013, 26 (9): 2756-2783 |
| [14] | Ciavarella A, Christidis N, Andrews M, et al. Upgrade of the HadGEM3-A based attribution system to high resolution and a new validation framework for probabilistic event attribution[J]. Weather and Climate Extremes, 2018: 9-32 |
| [15] | Walters D, Boutle I, Brooks M, et al. The met office unified model global atmosphere 6.0/6.1 and Jules global land 6.0/6.1 configurations[J]. Geoscientific Model Development, 2017, 10 (4): 1487-1520 |
| [16] | Stott P, Christidis N, Otto F, et al. Attribution of extreme weather events in the context of climate change[M]. Washington, DC: the National Academies Press, 2016 |
| [17] | 中国气象局气候变化中心. 中国气候变化蓝皮书(2021)[M]. 北京: 科学出版社, 2021. |
| China Meteorological Administration Climate Change Centre. Blue book on climate change in China (2021)[M]. Beijing: Science Press, 2021 (in Chinese) | |
| [18] | Sun Y, Zhang X B, Zwiers F W, et al. Rapid increase in the risk to extreme summer heat in eastern China[J]. Nature Climate Change, 2014, 4: 1082-1085 |
| [19] | Chen W, Dong B W. Drivers of the severity of the extreme hot summer of 2015 in western China[J]. Journal of Meteorological Research, 2019, 32 (6): 1002-1010 |
| [20] | Lu C H, Sun Y, Christidis N, et al. Contribution of global warming and atmospheric circulation to the hottest spring in eastern China in 2018[J]. Advances in Atmospheric Sciences, 2020, 37 (11): 1285-1294 |
| [21] | Qian C, Ye Y B, Jiang J C, et al. Rapid attribution of the record-breaking heatwave event in North China in June 2023 and future risks[J]. Environmental Research Letters, 2024, 19 (1): 014028 |
| [22] |
Song L C, Dong S Y, Sun Y, et al. Role of anthropogenic forcing in 2014 hot spring in northern China[J]. Bulletin of the American Meteorological Society, 2015, 96 (12): 111-114
doi: 10.1175/BAMS-D-15-00111.1 |
| [23] | Sun Y, Song L C, Yin H, et al. Human influence on the 2015 extreme high temperature events in western China[J]. Bulletin of the American Meteorological Society, 2016, 97 (12): 102-106 |
| [24] | Wang D Q, Sun Y. Effects of anthropogenic forcing and atmospheric circulation on the record-breaking welt bulb heat event over southern China in September 2021[J]. Advances in Climate Change Research, 2022, 13 (6): 778-786 |
| [25] | Jones B, O’neill B C, Mcdaniel L, et al. Future population exposure to US heat extremes[J]. Nature Climate Change, 2015, 5 (7): 652-655 |
| [26] | Xie W X, Zhou B T, Han Z Y, et al. Substantial increase in daytime-nighttime compound heat waves and associated population exposure in China projected by the CMIP6 multimodel ensemble[J]. Environmental Research Letters, 2022, 17 (4): 045007 |
| [27] | He T, Wang N, Tong Y D, et al. Anthropogenic activities change population heat exposure much more than natural factors and land use change: an analysis of 2020-2100 under SSP-RCP scenarios in Chinese cities[J]. Sustainable Cities and Society, 2023, 96: 104699 |
| [28] | Liu Z, Anderson B, Yan K, et al. Global and regional changes in exposure to extreme heat and the relative contributions of climate and population change[J]. Scientific Reports, 2017, 7 (1): 43909 |
| [29] | Zhang G W, Zeng G, Liang X Z, et al. Increasing heat risk in China’s urban agglomerations[J]. Environmental Research Letters, 2021, 16 (6): 064073 |
| [30] | Gao S J, Chen Y H, Chen D L, et al. Urbanization-induced warming amplifies population exposure to compound heatwaves but narrows exposure inequality between global north and south cities[J]. npj Climate and Atmospheric Science, 2024, 7 (1): 154 |
| [31] | Lin H, Yu X, Lin Y M, et al. Spatiotemporal variations of precipitation extremes and population exposure in the Beijing-Tianjin-Hebei region, China[J]. Water, 2024, 16 (24): 3594 |
| [32] | Sikarwar A, Golaz V. Substantial increase in population exposure to multiple environmental burdens in sub-Saharan Africa (2000-2019)[J]. Environmental Research Letters, 2024, 19 (4): 044068 |
| [33] | Mallapaty S. China’s extreme weather challenges scientists trying to study it[J]. Nature, 2022, 609 (7929): 888 |
| [34] | Cao L J, Zhu Y N, Tang G L, et al. Climatic warming in China according to a homogenized data set from 2419 stations[J]. International Journal of Climatology, 2016, 36 (13): 4384-4392 |
| [35] | 徐川, 赵天保, 张京朋, 等. CMIP6模式模拟的人类活动和自然强迫对全球地表气温多尺度变化的影响[J]. 地球物理学报, 2024, 67 (2): 477-491. |
| Xu C, Zhao T B, Zhang J P, et al. Effects of human activities and natural forcings on multiscale changes of global land surface air temperature simulated by CMIP6 models[J]. Chinese Journal of Geophysics, 2024, 67 (2): 477-491 (in Chinese) | |
| [36] | O’neill B C, Tebaldi C, van Vuuren D P, et al. The Scenario Model Intercomparison Project (ScenarioMIP) for CMIP 6 [J]. Geoscientific Model Development, 2016, 9 (9): 3461-3482 |
| [37] | Guo J H, Wang X Q, Fan Y R, et al. How extreme events in China would be affected by global warming: insights from a bias-corrected CMIP6 ensemble[J]. Earth’s Future, 2023, 11 (4): e2022EF003347 |
| [38] | Zhang C W, Wu G C, Zhao R Z, et al. The performance of CMIP6 models in describing the temperature annual cycle in China from 1961 to 2014[J]. Theoretical and Applied Climatology, 2023, 154 (1-2): 705-715 |
| [39] | Zhu H H, Jiang Z H, Li L. Projection of climate extremes in China, an incremental exercise from CMIP5 to CMIP6[J]. Science Bulletin (Beijing), 2021, 66 (24): 2528-2537 |
| [40] |
Liu L L, Cao X, Li S J, et al. A 31-year (1990-2020) global gridded population dataset generated by cluster analysis and statistical learning[J]. Scientific Data, 2024, 11 (1): 124
doi: 10.1038/s41597-024-02913-0 pmid: 38267476 |
| [41] | Sun Y, Hu T, Zhang X B. Substantial increase in heat wave risks in China in a future warmer world[J]. Earth’s Future, 2018, 6 (11): 1528-1538 |
| [42] | Zhang Y X, Sun Y, Hu T. Changes in extreme high temperature warning indicators over China under different global warming levels[J]. Science China: Earth Sciences, 2024, 67 (6): 1895-1909 |
| [43] | Seneviratne S I, Hauser M. Regional climate sensitivity of climate extremes in CMIP6 versus CMIP5 multimodel ensembles[J]. Earths Future, 2020, 8 (9): e2019EF001474 |
| [44] | Tang S K, Qiao S B, Wang B, et al. Linkages of unprecedented 2022 Yangtze River valley heatwaves to Pakistan flood and triple-dip La Niña[J]. npj Climate and Atmospheric Science, 2023, 6 (1): 44 |
| [45] | Hua W J, Dai A G, Qin M H, et al. How unexpected was the 2022 summertime heat extremes in the middle reaches of the Yangtze River?[J]. Geophysical Research Letters, 2023, 50 (16): e2023GL104269 |
| [46] | 史印山, 谷永利, 林艳. 京津冀高温天气的时空分布及环流特征分析[J]. 气象, 2009, 35 (6): 63-69. |
| Shi Y S, Gu Y L, Lin Y. Analysis of the temporal and spatial distribution and circulation features of high temperatures in Beijing, Tianjin and Hebei[J]. Meteorological Monthly, 2009, 35 (6): 63-69 (in Chinese) | |
| [47] | Gong H N, Ma K J, Hu Z Y, et al. Attribution of the August 2022 extreme heatwave in southern China: role of dynamical and thermodynamical processes[J]. Bulletin of the American Meteorological Society, 2024, 105 (1): 193-199 |
| [48] | Xu K, Lu R Y, M J Y, et al. Circulation anomalies in the mid-high latitudes responsible for the extremely hot summer of 2018 over Northeast Asia[J]. Atmospheric and Oceanic Science Letters, 2019, 12 (4): 231-237 |
| [1] | 陈思达, 刘凯, 李博浩, 汪明. 中国脱贫县破纪录极端天气事件研究[J]. 气候变化研究进展, 2025, 21(3): 327-339. |
| [2] | 周天仪, 江志红, 李伟, 孙岑霄. 不同物理约束方案下西北地区夏季降水的未来预估对比[J]. 气候变化研究进展, 2024, 20(4): 403-415. |
| [3] | 孙晓玲, 谢文欣, 周波涛. CMIP6模式对亚洲陆地生态系统的模拟评估与预估[J]. 气候变化研究进展, 2023, 19(1): 49-62. |
| [4] | 涂锴, 严中伟, 范丽军, 李珍. 基于动态重现期的极端高温气候评估方法研究[J]. 气候变化研究进展, 2023, 19(1): 11-22. |
| [5] | 张歆然, 陈昊明. CMIP6模式对青藏高原东坡暖季降水的模拟评估[J]. 气候变化研究进展, 2022, 18(2): 129-141. |
| [6] | 黄禄丰, 朱再春, 黄萌田, 赵茜, 马伟蕊, 曾辉. 基于CMIP6模式优化集合平均预估21世纪全球陆地生态系统总初级生产力变化[J]. 气候变化研究进展, 2021, 17(5): 514-524. |
| [7] | 汤秭晨, 李清泉, 王黎娟, 伍丽泉. CMIP6年代际试验对中国气温预测能力的初步评估[J]. 气候变化研究进展, 2021, 17(2): 162-174. |
| [8] | 纪多颖,张倩,骆祉丞,陈扬馨. CMIP6二氧化碳移除模式比较计划(CDRMIP)概况与评述[J]. 气候变化研究进展, 2019, 15(5): 457-464. |
| [9] | 张丽霞,陈晓龙,辛晓歌. CMIP6情景模式比较计划(ScenarioMIP)概况与评述[J]. 气候变化研究进展, 2019, 15(5): 519-525. |
| [10] | 宋振亚,鲍颖,乔方利. FIO-ESM v2.0模式及其参与CMIP6的方案[J]. 气候变化研究进展, 2019, 15(5): 558-565. |
| [11] | 钱诚,张文霞. CMIP6检测归因模式比较计划(DAMIP)概况与评述[J]. 气候变化研究进展, 2019, 15(5): 469-475. |
| [12] | 曹剑,马利斌,李娟,王斌,王波. NUIST-ESM模式及其参与CMIP6的方案[J]. 气候变化研究进展, 2019, 15(5): 566-570. |
| [13] | 王磊,包庆,何编. CMIP6高分辨率模式比较计划(HighResMIP)概况与评述[J]. 气候变化研究进展, 2019, 15(5): 498-502. |
| [14] | 辛晓歌,吴统文,张洁,张芳,李伟平,张艳武,路屹雄,房永杰,颉卫华,张莉,董敏,史学丽,李江龙,储敏,刘茜霞,颜京辉. BCC模式及其开展的CMIP6试验介绍[J]. 气候变化研究进展, 2019, 15(5): 533-539. |
| [15] | 唐彦丽,俞永强,李立娟,董理,谢瑾博,林鹏飞,普业,王斌,王妍,贾炳浩,秦佩华,宋米荣,谢正辉. FGOALS-g模式及其参与CMIP6的方案[J]. 气候变化研究进展, 2019, 15(5): 551-557. |
| 阅读次数 | ||||||
|
全文 |
|
|||||
|
摘要 |
|
|||||