气候变化研究进展 ›› 2025, Vol. 21 ›› Issue (5): 659-670.doi: 10.12006/j.issn.1673-1719.2025.023
亚洲中高纬区生态系统对高温热浪暴露度的多模式集合预估
孙晓玲1,2( ), 谢文欣1, 周波涛1()
- 1
南京信息工程大学气候系统预测与变化应对全国重点实验室/气象灾害教育部重点实验室/气象灾害预报预警与评估协同创新中心 南京 210044
2济南高新技术产业开发区气象局 济南 250102
-
收稿日期:2025-02-05修回日期:2025-03-27出版日期:2025-09-30发布日期:2025-09-22 -
通讯作者:周波涛,男,教授,zhoubt@nuist.edu.cn -
作者简介:孙晓玲,女,助理工程师,nlysxl@163.com -
基金资助:国家自然科学基金(41991285)
Ensemble projection of changes in the ecosystem exposure to heatwaves over mid-high latitude Asia
SUN Xiao-Ling1,2(), XIE Wen-Xin1, ZHOU Bo-Tao1()
- 1
State Key Laboratory of Climate System Prediction and Risk Management/Key Laboratory of Meteorological Disaster ,Ministry of Education/Collaborative Innovation Center on Forecast and Evaluation of Meteorological Disasters, Nanjing University of Information Science and Technology Nanjing 210044, China
2Jinan High-Tech Industrial Development Zone Weather Station Jinan 250102, China
-
Received:2025-02-05Revised:2025-03-27Online:2025-09-30Published:2025-09-22
摘要:
基于8个CMIP6模式的逐日最高气温以及逐月叶面积指数(LAI)、总初级生产力(GPP)和净初级生产力(NPP)数据,预估了3种情景(SSP1-2.6、SSP2-4.5、SSP5-8.5)下亚洲中高纬区高温热浪日数(HWD)的未来变化以及该区生态系统对其暴露度的响应。多模式集合(MME)预估结果表明:未来3种情景下整个亚洲中高纬区的HWD将增加。温室气体排放越多,HWD增加越显著。随着高温热浪的增加,未来LAI、GPP和NPP的暴露度也将增加。其中以SSP5-8.5情景下的增幅最大,LAI、GPP和NPP的暴露度到21世纪末期相比参考时期(1995—2014年)将分别增加12.1倍,14.9倍和14.3倍,特别是在勘察加半岛、中亚南部、中国新疆、韩国和日本等地。从影响陆地生态系统暴露度的因素来看,气候因子占主导作用,其次为非线性因子,生态因子的贡献最小。随着温室气体排放增多,从21世纪近期到末期,气候和生态因子的贡献逐渐减小,非线性因子的贡献不断增大,高温热浪对陆地生态系统的影响将更倾向于气候和生态系统的综合作用。
引用本文
孙晓玲, 谢文欣, 周波涛. 亚洲中高纬区生态系统对高温热浪暴露度的多模式集合预估[J]. 气候变化研究进展, 2025, 21(5): 659-670.
SUN Xiao-Ling, XIE Wen-Xin, ZHOU Bo-Tao. Ensemble projection of changes in the ecosystem exposure to heatwaves over mid-high latitude Asia[J]. Climate Change Research, 2025, 21(5): 659-670.
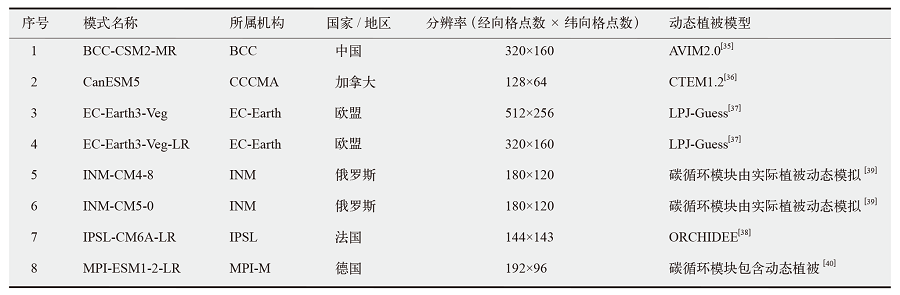 |
表1 8个CMIP6模式的基本信息
Table 1 Basic information of 8 CMIP6 models used
| |

图1 研究区示意图
Fig. 1 Schematic diagram of the study area
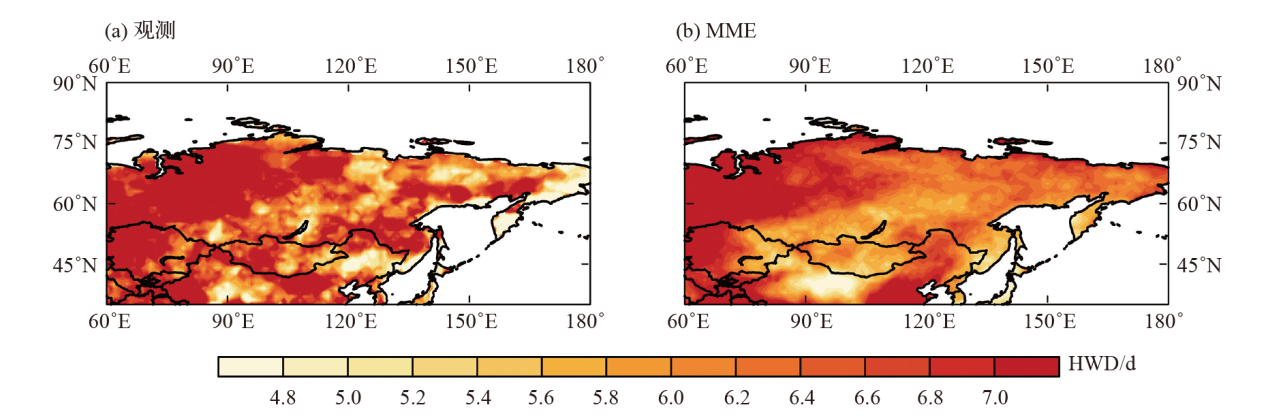
图2 观测(a)和MME模拟(b)的亚洲中高纬区1995—2014年平均HWD的气候态分布
Fig. 2 Climatological distribution of observed (a) and MME simulated (b) HWD during 1995-2014
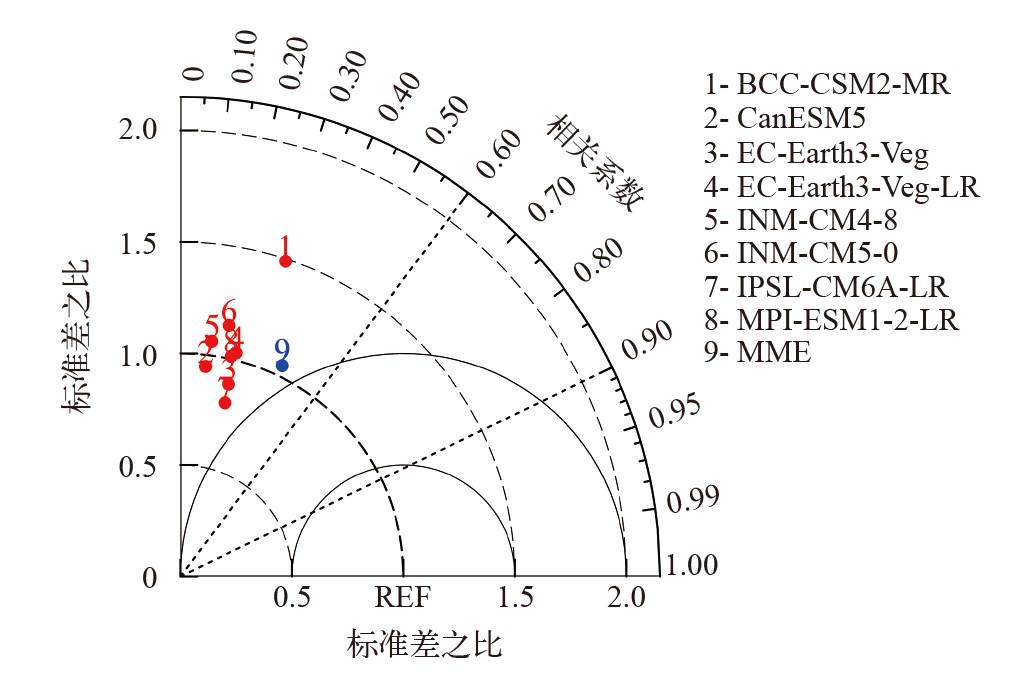
图3 CMIP6模式模拟1995—2014年亚洲中高纬区年平均HWD气候态空间分布的泰勒图
Fig. 3 Taylor diagram of CMIP6 models referring the climatological distribution of annual mean HWD over mid-high latitude Asia during 1995-2014
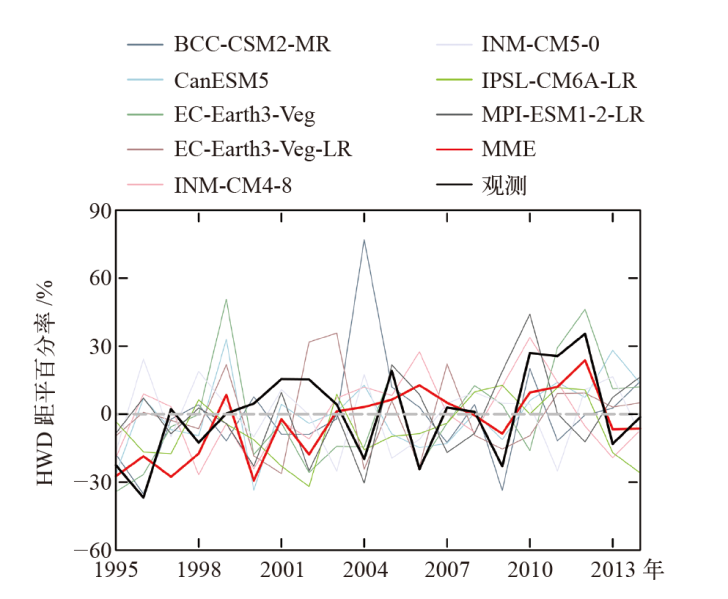
图4 1995—2014年观测和MME模拟的亚洲中高纬区年平均HWD距平百分率时间序列
Fig. 4 Time series of observed and MME simulated annual mean percentage of HWD anomaly over mid-high latitude Asia during 1995-2014
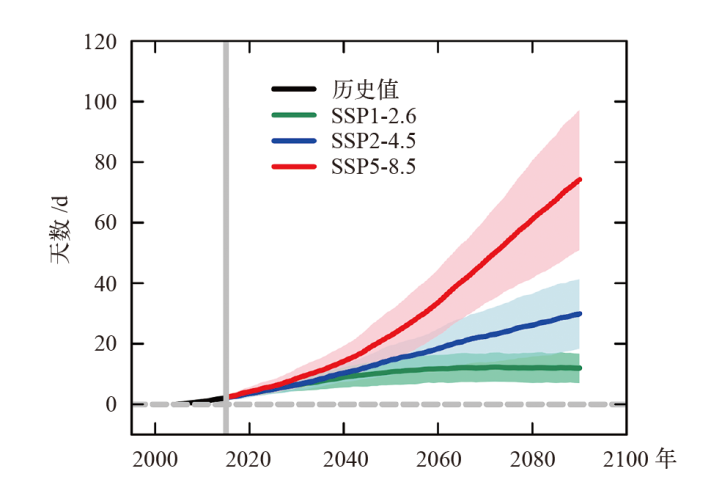
图5 SSP1-2.6、SSP2-4.5和SSP5-8.5情景下亚洲中高纬区区域平均的HWD变化(相对于1995—2014年,下同) 注:时间序列进行20 a滑动平均,阴影表示模式间±标准差范围。
Fig. 5 Temporal changes in HWD averaged over mid-high latitude Asian under SSP1-2.6, SSP2-4.5, and SSP5-8.5 (relative to 1995-2014, the same below). (Time series are smoothed with a 20-year running mean filter, and shadings represent the ranges of two standard deviations of model simulations)
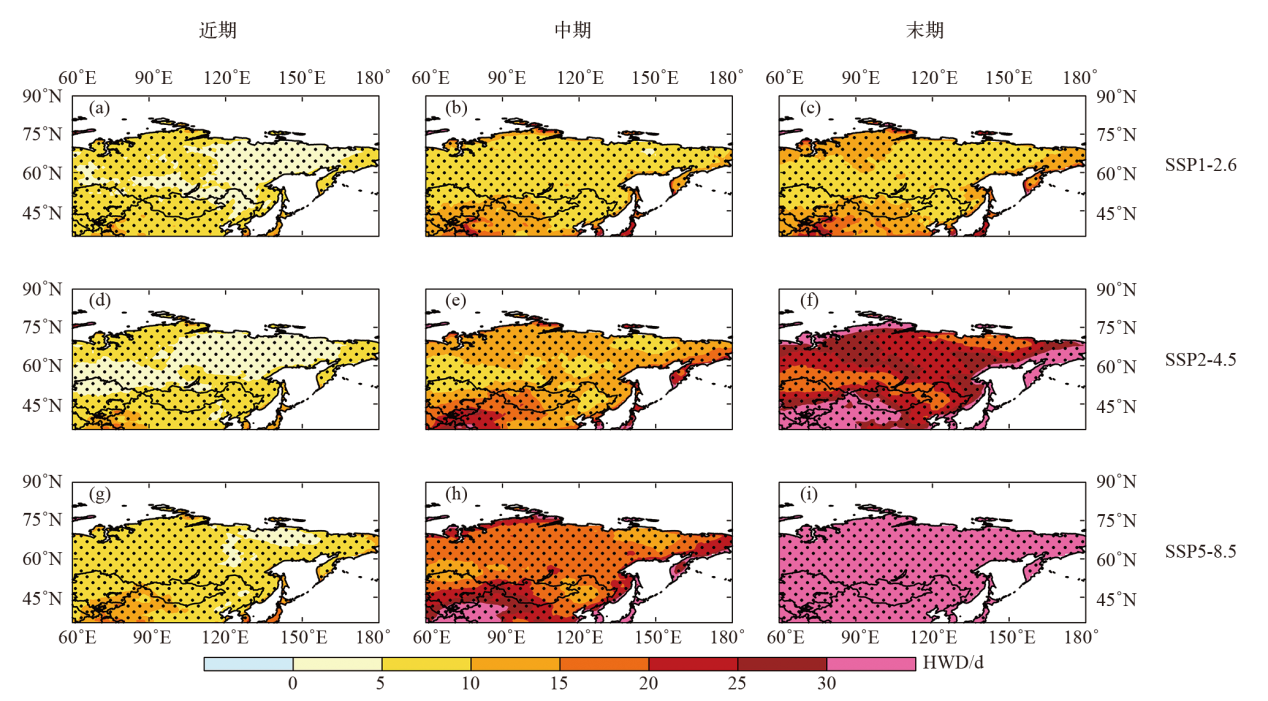
图6 MME预估的SSP1-2.6、SSP2-4.5和SSP5-8.5情景下到21世纪近期(2021—2040年)、中期(2041—2060年)和末期(2081—2100年)亚洲中高纬度地区的HWD变化 注:打点区域表示通过0.05的显著性检验。
Fig. 6 Spatial distribution of the MME projected changes in HWD during 2021-2040, 2041-2060, and 2081-2100 under SSP1-2.6, SSP2-4.5, and SSP5-8.5. (Areas with the changes above the 0.05 significance level are dotted)
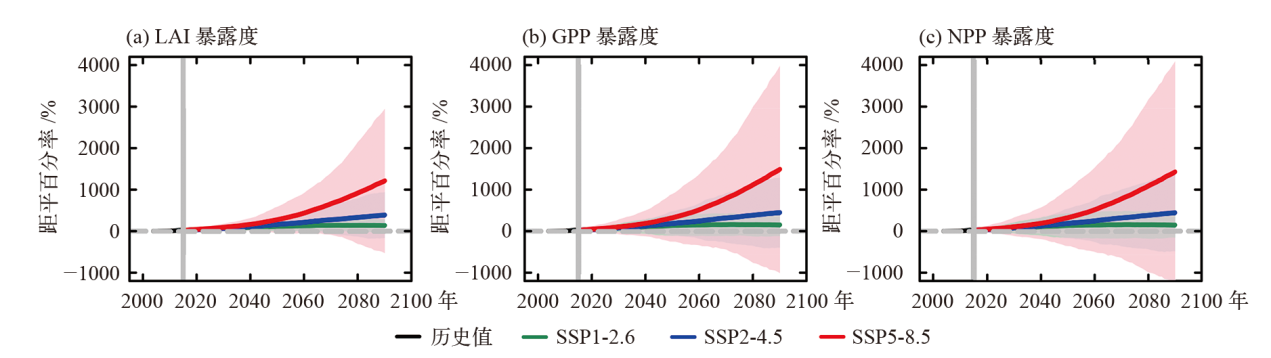
图7 三种情景下亚洲中高纬区陆地生态系统LAI暴露度(a)、GPP暴露度(b)和NPP暴露度(c)的距平百分率时间序列 注:时间序列进行20 a滑动平均,阴影表示模式间±标准差范围。
Fig. 7 Temporal changes in percentage anomalies of LAI exposure (a), GPP exposure (b), and NPP exposure (c) averaged over mid-high latitude Asia under three scenarios. (Time series are smoothed with a 20-year running mean filter, and shadings represent the ranges of two standard deviations of model simulations)
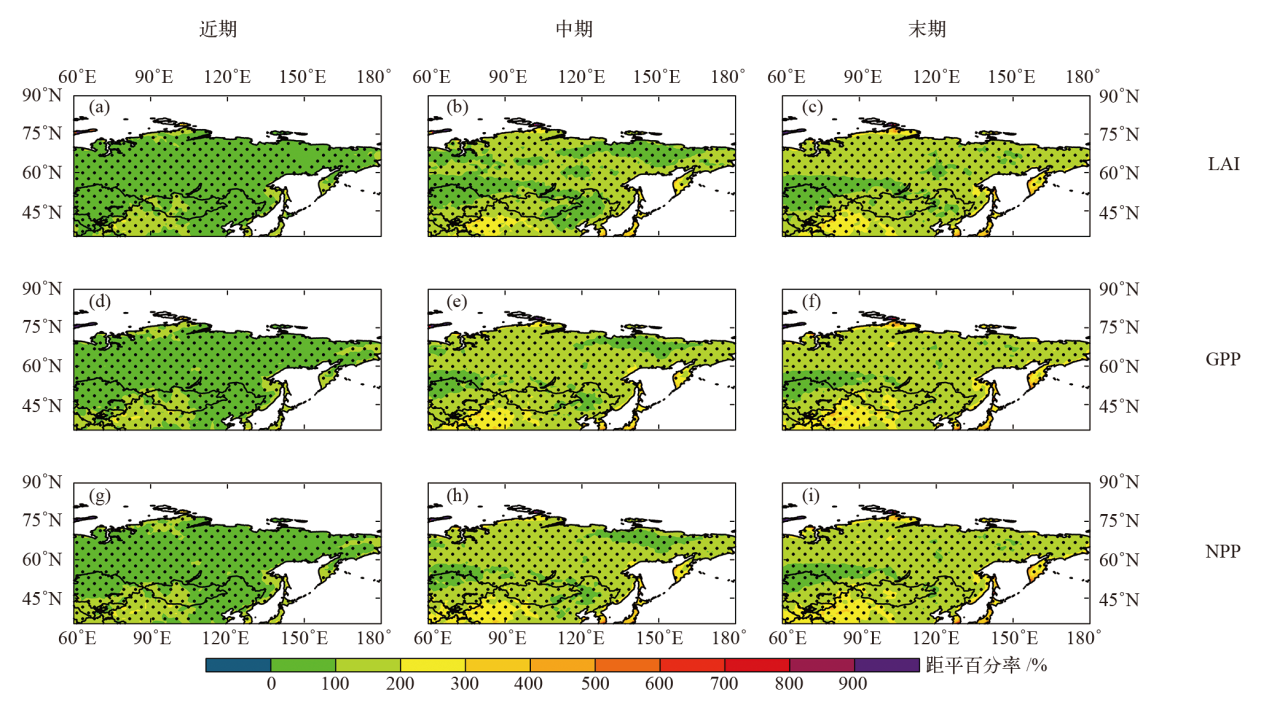
图8 MME预估的SSP1-2.6情景下到21世纪近期、中期和末期亚洲中高纬度地区LAI暴露度、GPP暴露度和NPP暴露度的距平百分率 注:打点区域表示通过0.05的显著性检验。
Fig. 8 Spatial distribution of the MME projected percentage anomalies of LAI exposure, GPP exposure, and NPP exposure during 2021-2040, 2041-2060, and 2081-2100 under SSP1-2.6. (Areas with the changes above the 0.05 significance level are dotted)
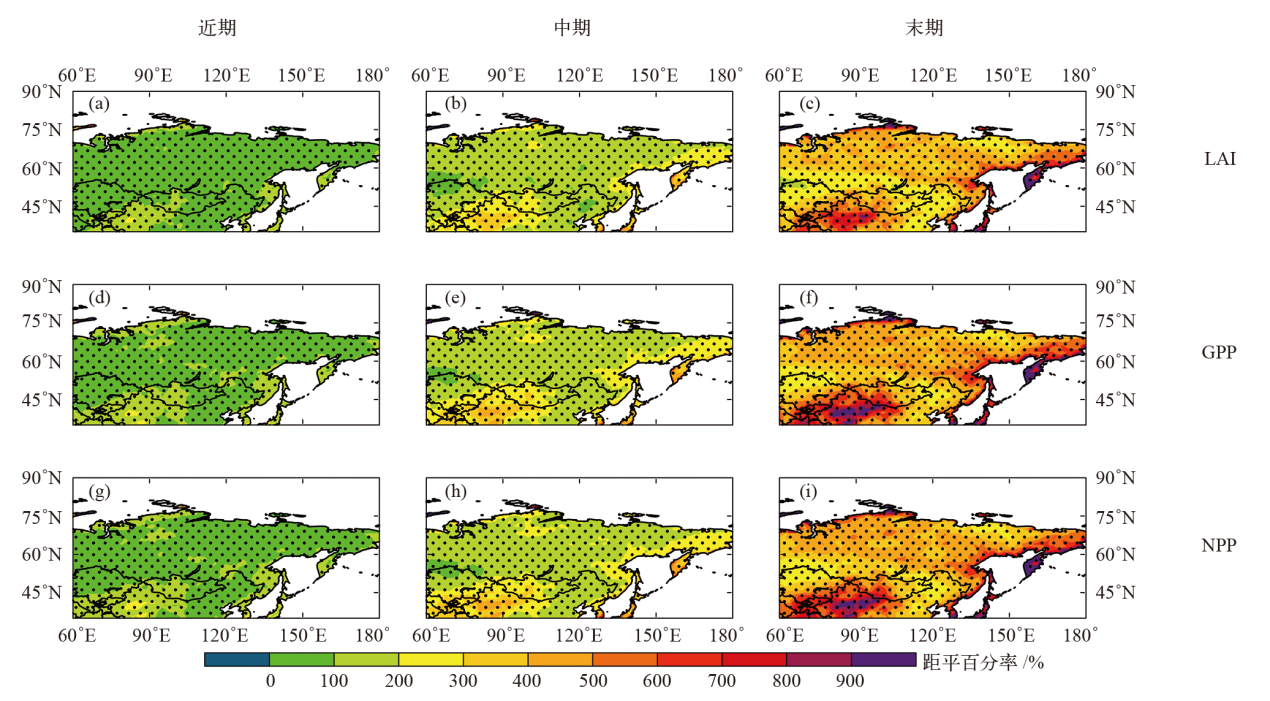
图9 同图8,但为SSP2-4.5情景 注:打点区域表示通过0.05的显著性检验。
Fig. 9 Same as Fig. 8, but under SSP2-4.5

图10 同图8,但为SSP5-8.5情景
Fig. 10 Same as Fig. 8, but under SSP5-8.5
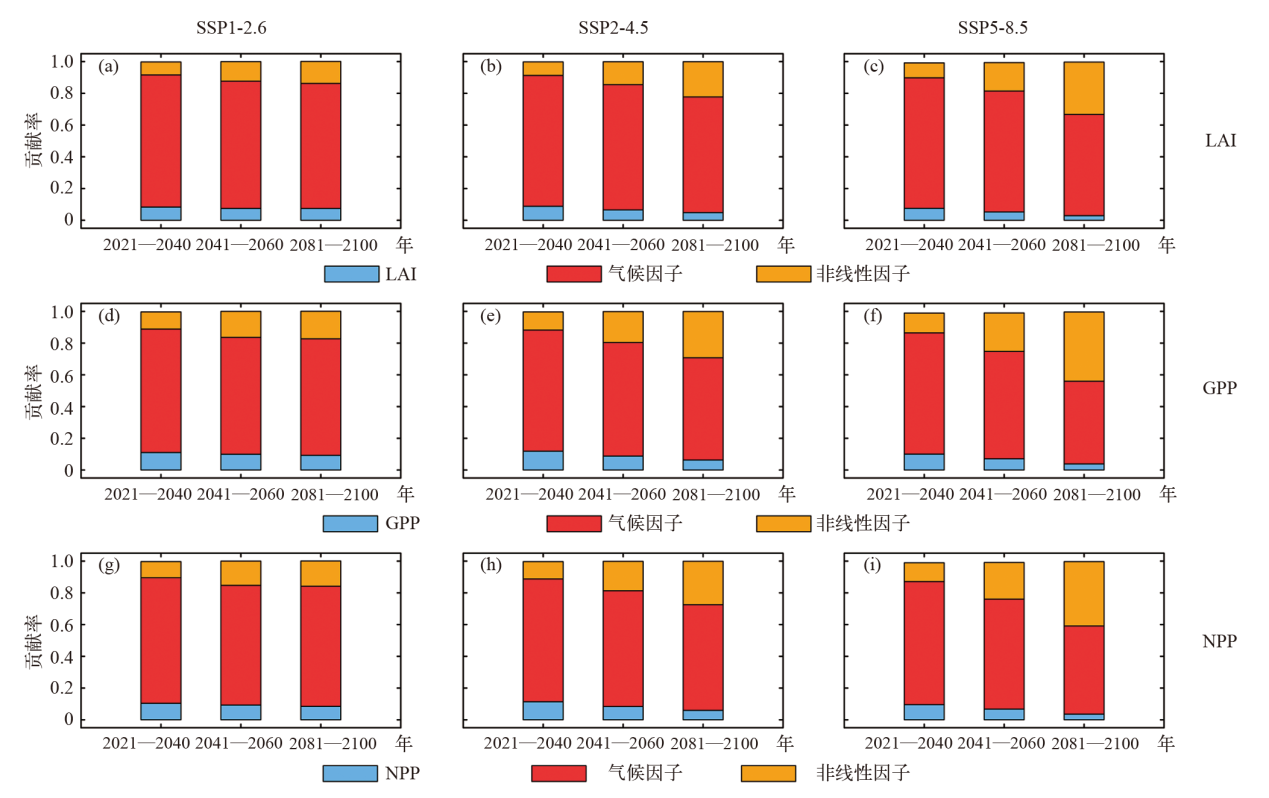
图11 三种情景下到21世纪近期、中期和末期时,气候因子、非线性因子和生态因子对亚洲中高纬度区LAI暴露度、GPP暴露度和NPP暴露度变化的贡献
Fig. 11 Contribution of climate factor, nonlinear interaction, and ecological factor to projected changes in LAI exposure, GPP exposure, and NPP exposure averaged over mid-high latitude Asia during 2021-2040, 2041-2060, and 2081-2100 under three scenarios
| [1] | Han Q M, Sun S, Liu Z, et al. Accelerated exacerbation of global extreme heatwaves under warming scenarios[J]. International Journal of Climatology, 2022, 42 (11): 5430-5441 |
| [2] | IPCC. Climate change 2021: the physical science basis[M]. Cambridge: Cambridge University Press, 2021 |
| [3] | Dosio A. Projection of temperature and heat waves for Africa with an ensemble of CORDEX Regional Climate Models[J]. Climate Dynamics, 2017, 49 (1-2): 493-519 |
| [4] |
Sun Q H, Miao C Y, Hanel M, et al. Global heat stress on health, wildfires, and agricultural crops under different levels of climate warming[J]. Environment International, 2019, 128: 125-136
doi: S0160-4120(18)32865-4 pmid: 31048130 |
| [5] | Chapin F S, Randerson J T, McGuire A D, et al. Changing feedbacks in the climate-biosphere system[J]. Frontiers in Ecology and the Environment, 2008, 6 (6): 313-320 |
| [6] |
Frank D, Reichstein M, Bahn M, et al. Effects of climate extremes on the terrestrial carbon cycle: concepts, processes and potential future impacts[J]. Global Change Biology, 2015, 21 (8): 2861-2880
doi: 10.1111/gcb.12916 pmid: 25752680 |
| [7] | Erol A, Ekinci K, Akbolat D, et al. Modeling impacts of land uses on carbon and nitrogen contents, carbon dioxide and water effluxes of Mediterranean soils[J]. Polish Journal of Environmental Studies, 2016, 25 (4): 1479-1487 |
| [8] | 张嘉仪, 钱诚. 1960—2018年中国高温热浪的线性趋势分析方法与变化趋势[J]. 气候与环境研究, 2020, 25 (3): 225-239. |
| Zhang J Y, Qian C. Linear trend in occurrence of high temperature and heat waves in China for the 1960-2018 period: method and analysis results[J]. Climatic and Environmental Research, 2020, 25 (3): 225-239 (in Chinese) | |
| [9] | Yuan W P, Cai W W, Chen Y, et al. Severe summer heatwave and drought strongly reduced carbon uptake in Southern China[J]. Scientific Reports, 2016, 6 (1): 18813 |
| [10] | Zhang F W, Cao G M. Resilience of energy and CO2 exchange to a summer heatwave in an alpine humid grassland on the Qinghai-Tibetan Plateau[J]. Polish Journal of Environmental Studies, 2017, 26 (1): 385-394 |
| [11] |
Brilli F, Hörtnagl L J, Hammerle A, et al. Leaf and ecosystem response to soil water availability in mountain grasslands[J]. Agricultural and Forest Meteorology, 2011, 151 (12): 1731-1740
pmid: 24465071 |
| [12] | De Boeck H J, Dreesen F E, Janssens I A, et al. Climatic characteristics of heat waves and their simulation in plant experiments[J]. Global Change Biology, 2010, 16 (7): 1992-2000 |
| [13] | Hoover D L, Knapp A K, Smith M D. Resistance and resilience of a grassland ecosystem to climate extremes[J]. Ecology, 2014, 95 (9): 2646-2656 |
| [14] | Von Buttlar J, Zscheischler J, Rammig A, et al. Impacts of droughts and extreme-temperature events on gross primary production and ecosystem respiration: a systematic assessment across ecosystems and climate zones[J]. Biogeosciences, 2018, 15 (5): 1293-1318 |
| [15] | Pan Y D, Birdsey R A, Fang J Y, et al. A large and persistent carbon sink in the world’s forests[J]. Science, 2011, 333 (6045): 988-993 |
| [16] | Schuur E A G, McGuire A D, Schadel C, et al. Climate change and the permafrost carbon feedback[J]. Nature, 2015, 520 (7546): 171-179 |
| [17] | Gang C C, Zhang Y Z, Wang Z Q, et al. Modeling the dynamics of distribution, extent, and NPP of global terrestrial ecosystems in response to future climate change[J]. Global and Planetary Change, 2017, 148 (G1): 153-165 |
| [18] |
Lucht W, Prentice I C, Myneni R B, et al. Climatic control of the high-latitude vegetation greening trend and Pinatubo effect to cite this version: HAL Id: hal-01757611 climatic control of the high-latitude vegetation greening trend and pinatubo effect[J]. Science, 2002, 296 (5573): 1687-1689
pmid: 12040194 |
| [19] |
Perkins-Kirkpatrick S E, Lewis S C. Increasing trends in regional heatwaves[J]. Nature Communications, 2020, 11 (1): 3357
doi: 10.1038/s41467-020-16970-7 pmid: 32620857 |
| [20] | Xin N, Zhou B T, Chen H S, et al. Variability of spring ecosystem water use efficiency in Northeast Asia and its linkage to the Polar-Eurasia pattern[J]. Environmental Research Letters, 2023, 18 (9): 094055 |
| [21] |
Nemani R R, Keeling C D, Hashimoto H, et al. Climate-driven increases in global terrestrial net primary production from 1982 to 1999[J]. Science, 2003, 300 (5625): 1560-1563
pmid: 12791990 |
| [22] |
Zhu Z C, Piao S L, Myneni R B, et al. Greening of the Earth and its drivers[J]. Nature Climate Change, 2016, 6 (8): 791-795
doi: 10.1038/NCLIMATE3004 |
| [23] | 孙晓玲, 谢文欣, 周波涛. CMIP6模式对亚洲陆地生态系统的模拟评估与预估[J]. 气候变化研究进展, 2023, 19 (1): 49-62. |
| Sun X L, Xie W X, Zhou B T. CMIP6 evaluation and projection of terrestrial ecosystem over Asia[J]. Climate Change Research, 2023, 19 (1): 49-62 (in Chinese) | |
| [24] | Park S B, Park C E, Kim J S, et al. The 2020 heatwave led to a larger enhancement in annual gross primary production in West Siberia than in East Siberia[J]. Journal of Geophysical Research: Biogeosciences, 2025, 130 (2): e2024JG008487 |
| [25] | Trenberth K E, Fasullo J T. Climate extremes and climate change: the Russian heat wave and other climate extremes of 2010[J]. Journal of Geophysical Research: Atmospheres, 2012, 117 (D17): D17103 |
| [26] | Bastos A, Gouveia C M, Trigo R M, et al. Analysing the spatio-temporal impacts of the 2003 and 2010 extreme heatwaves on plant productivity in Europe[J]. Biogeosciences, 2014, 11 (13): 3421-3435 |
| [27] | Smith M D. An ecological perspective on extreme climatic events: a synthetic definition and framework to guide future research[J]. Journal of Ecology, 2011, 99 (3): 656-663 |
| [28] | 尹姗, 孙诚, 李建平. 灾害风险的决定因素及其管理[J]. 气候变化研究进展, 2012, 8 (2): 84-89. |
| Yin S, Sun C, Li J P. Determinants of disaster risk and disaster risk management[J]. Climate Change Research, 2012, 8 (2): 84-89 (in Chinese) | |
| [29] | Li Z S, Guo X L, Yang Y, et al. Heatwave trends and the population exposure over China in the 21st century aswell as under 1.5℃ and 2.0℃ global warmer future scenarios[J]. Sustainability, 2019, 11 (12): 3318 |
| [30] | 吕嫣冉, 姜彤, 陶辉, 等. “一带一路”区域极端高温事件与人口暴露度特征[J]. 科技导报, 2020, 38 (16): 68-79. |
| Lyu Y R, Jiang T, Tao H, et al. Spatial-temporal patterns of population exposed to the extreme maximum temperature events in the Belt and Road regions[J]. Science & Technology Review, 2020, 38 (16): 68-79 (in Chinese) | |
| [31] | 张丽霞, 陈晓龙, 辛晓歌. CMIP6情景模式比较计划(ScenarioMIP)概况与评述[J]. 气候变化研究进展, 2019, 15 (5): 519-525. |
| Zhang L X, Chen X L, Xin X G. Short commentary on CMIP6 Scenario Model Intercomparison Project (ScenarioMIP)[J]. Climate Change Research, 2019, 15 (5): 519-525 (in Chinese) | |
| [32] | Fang H L, Baret F, Plummer S, et al. An overview of global leaf area index (LAI): methods, products, validation, and applications[J]. Reviews of Geophysics, 2019, 57 (3): 739-799 |
| [33] | 方精云, 柯金虎, 唐志尧, 等. 生物生产力的“4P”概念、估算及其相互关系[J]. 植物生态学报, 2001, 25 (4): 414-419. |
| Fang J Y, Ke J H, Tang Z R, et al. Implications and estimations of four terrestrial productivity parameters[J]. Chinese Journal of Plant Ecology, 2001, 25 (4): 414-419 (in Chinese) | |
| [34] | Peng X B, Yu M, Chen H S. Projected changes in terrestrial vegetation and carbon fluxes under 1.5℃ and 2.0℃ global warming[J]. Atmosphere, 2022, 13 (1): 42 |
| [35] | Li W P, Zhang Y W, Shi X L, et al. Development of land surface model BCC_AVIM2.0 and its preliminary performance in LS3MIP/CMIP6[J]. Journal of Meteorological Research, 2019, 33 (5): 851-869 |
| [36] |
Swart N C, Cole J N S, Kharin V V, et al. The Canadian Earth System Model version 5 (CanESM5.0.3)[J]. Geoscientific Model Development, 2019, 12 (11): 4823-4873
doi: 10.5194/gmd-12-4823-2019 |
| [37] | Wyser K, Van Noije T, Yang S T, et al. On the increased climate sensitivity in the EC-Earth model from CMIP5 to CMIP6[J]. Geoscientific Model Development, 2020, 13 (8): 3465-3474 |
| [38] | Volodin E M, Mortikov E V, Kostrykin S V, et al. Simulation of the modern climate using the INM-CM48 climate model[J]. Russian Journal of Numerical Analysis and Mathematical Modelling, 2018, 33 (6): 367-374 |
| [39] | Lurton T, Balkanski Y, Bastrikov V, et al. Implementation of the CMIP6 forcing data in the IPSL-CM6A-LR model[J]. Journal of Advances in Modeling Earth Systems, 2020, 12 (4): e2019MS001940 |
| [40] |
Mauritsen T, Bader J, Becker T, et al. Developments in the MPI-M Earth System Model version 1.2 (MPI-ESM1.2) and its response to increasing CO2[J]. Journal of Advances in Modeling Earth Systems, 2019, 11 (4): 998-1038
doi: 10.1029/2018MS001400 pmid: 32742553 |
| [41] | Russo S, Sillmann J, Fischer E M. Top ten European heatwaves since 1950 and their occurrence in the coming decades[J]. Environmental Research Letters, 2015, 10 (12): 124003 |
| [42] | Taylor K E. Summarizing multiple aspects of model performance in a single diagram[J]. Journal of Geophysical Research: Atmospheres, 2001, 106 (D7): 7183-7192 |
| [43] | 蒋文好, 陈活泼. CMIP6模式对亚洲中高纬区极端温度变化的模拟及预估[J]. 大气科学学报, 2021, 44 (4): 592-603. |
| Jiang W H, Chen H P. Assessment and projection of changes in temperature extremes over the mid-high latitudes of Asia based on CMIP6 models[J]. Transactions of Atmospheric Sciences, 2021, 44 (4): 592-603 (in Chinese) | |
| [44] | Yan M C, Yue X, Zhou B T, et al. Projected changes of ecosystem productivity and their responses to extreme heat events in northern Asia[J]. Frontiers in Earth Science, 2022, 10: 970296 |
| [45] |
Niu S L, Luo Y Q, Fei S F, et al. Thermal optimality of net ecosystem exchange of carbon dioxide and underlying mechanisms[J]. New Phytologist, 2012, 194 (3): 775-783
doi: 10.1111/j.1469-8137.2012.04095.x pmid: 22404566 |
| [46] |
De Boeck H J, Dreesen F E, Janssens I A, et al. Whole-system responses of experimental plant communities to climate extremes imposed in different seasons[J]. New Phytologist, 2011, 189 (3): 806-817
doi: 10.1111/j.1469-8137.2010.03515.x pmid: 21054412 |
| [47] | Buermann W, Bikash P R, Jung M, et al. Earlier springs decrease peak summer productivity in North American boreal forests[J]. Environmental Research Letters, 2013, 8 (2): 024027 |
| [1] | 周天军, 陈梓明, 陈晓龙, 左萌, 江洁, 胡帅. IPCC AR6报告解读:未来的全球气候——基于情景的预估和近期信息[J]. 气候变化研究进展, 2021, 17(6): 652-663. |
| [2] | 张弥, 马红云, 林卉娇, 李海俊, 王莹. 不同类型冷却屋顶方案对城市群热环境的缓解效果[J]. 气候变化研究进展, 2021, 17(1): 45-57. |
| [3] | 张领雁,张朝,侯斌. 高温热浪致死风险的人群和城市分异及保险费率厘定的研究[J]. 气候变化研究进展, 2018, 14(5): 475-484. |
| [4] | 王怡, 刘冠秋, 齐熙, 潘丹琳, 祁新华. 高温热浪支付意愿人群分异及其影响因素——以福州市为例[J]. 气候变化研究进展, 2017, 13(2): 172-180. |
| [5] | 罗晓玲, 杜尧东, 郑璟. 广东高温热浪致人体健康风险区划[J]. 气候变化研究进展, 2016, 12(2): 139-146. |
| [6] | 叶殿秀 尹继福 陈正洪 郑有飞 吴荣军. 1961—2010年我国夏季高温热浪的时空变化特征[J]. 气候变化研究进展, 2013, 9(1): 15-20. |
| 阅读次数 | ||||||
|
全文 |
|
|||||
|
摘要 |
|
|||||