

引言
大气温度是表征大气状态的基本气候变量之一,也是气候变化的重要指标。目前,全球对流层至平流层大气温度观测主要来自卫星遥感和常规探空观测。前者通过卫星搭载微波探测仪测量50~60 GHz氧气吸收带的辐射间接测量,后者通过探空气球携带无线电探空仪直接测量。两者互为独立观测系统,各具优势和不足。探空观测历史相对较长,但海洋极地测站稀少且探空气球上升高度有限,存在观测盲区。卫星遥感覆盖全球对流层和平流层大气,恰好可以弥补探空观测的不足,但观测历史相对较短,垂直方向分辨率较低。两者最初均为天气应用,关注短时气象要素变化,而气候应用关注较长时段气象要素偏离气候平均态的程度(即距平)及其随时间演变(即变化趋势)。距平和趋势数值通常比气象要素小1~2个量级。因此,气候应用对观测连续性、精准度和稳定性要求更高,需将多个时段历史观测均一化处理为连续稳定的长时间序列。直接拼接或将引入观测系统变化导致的非均一性问题,易与气候变化信号混淆,产生虚假的变化趋势[1]。20世纪70年代以来,美国国家海洋大气管理局(NOAA)发射业务环境系列卫星,先后搭载微波探测器(MSU)、先进微波探测器(AMSU)和先进技术微波探测器(ATMS),开展全球大气温度垂直探测,目前已积累40余年资料,广泛应用于数值天气预报、天气分析和气候研究领域。尤其是20世纪90年代以来,NOAA卫星观测亮温成为IPCC报告评估全球气温变化趋势最重要的源资料[2-
我国利用极轨卫星开展大气温度探测始于2008年5月,风云三号A星(简称FY-3A)搭载微波温度计(简称MWTS,与MSU接近)首次实现全球大气温度垂直探测。近十余年来,风云三号卫星微波载荷和辐射定标技术取得长足进展。风云三号系列6颗卫星相继搭载三代微波温度计(MWTS-I/II/III,分别与MSU/AMSU/ATMS接近)开展全球气温观测,为数值天气预报和灾害过程监测提供了基础观测信息[14-15],但不同卫星和微波温度计变化导致的非均一性问题极大地限制了其在气候变化研究中的应用。近年来,国家卫星气象中心参考国际同类卫星微波载荷(METOP/AMSU-A和SNPP/ATMS)对FY-3A/B和FY-3C/D 历史观测气温进行再定标处理,修正了定标偏差和多星代际差异,建成风云三号微波观测2008—2020年历史再定标资料集[16-17],为后续建立风云卫星网格化气温气候数据集提供了基础支撑。与国际均一化卫星气温资料集相比,历史再定标气温资料未修正轨道漂移导致的气温日变化偏差,连续性和时效性亦不能满足气候应用需求。为了有效推进风云卫星气温观测气候应用,迫切需要对风云三号卫星业务观测气温开展气候应用评估。世界气象组织(WMO)全球气候观测系统(GCOS)对基本气候变量(ECV)观测要求包括时空分辨率、时效性、精准性和稳定性等指标(GCOS-245)[18],其中时空分辨率和时效性与系统设计参数,业务运行卫星均可满足。目前对风云卫星气温观测评估多集中在精准性,指标采用观测与参照差值的均方根误差和标准差[16,19-
1 数据与方法
1.1 数据
本文评估的气温资料为FY-3D/MWTS-II业务观测全球逐日轨道亮温1级数据(L1),来自国家卫星气象中心风云卫星遥感数据服务网①(①
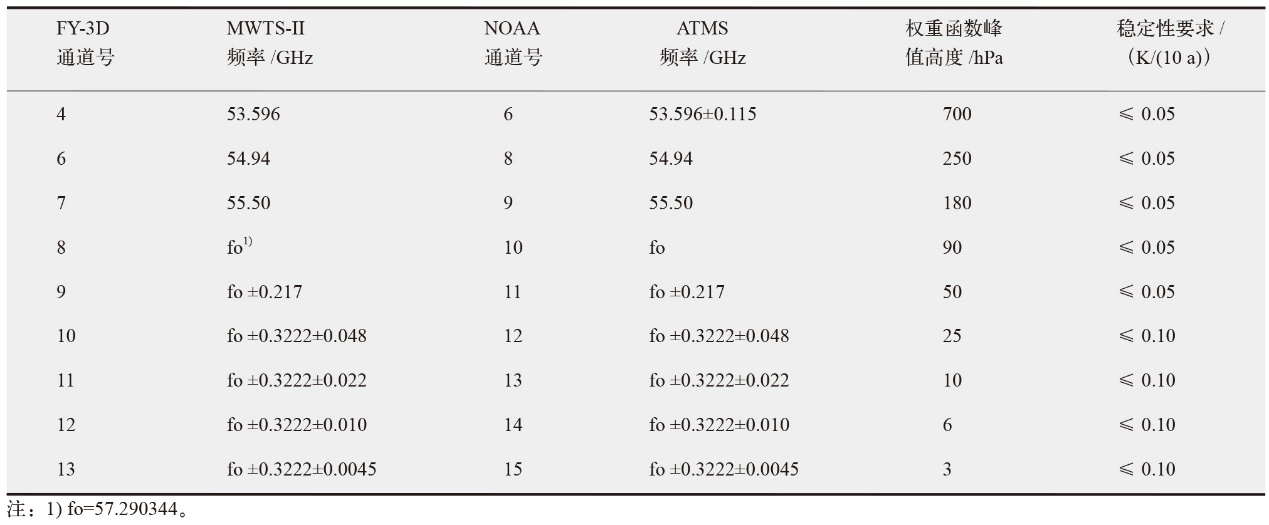
表1 FY-3D和NOAA卫星微波气温探测通道参数对比和气候变化应用稳定性需求
Table 1
 |
1.2 方法
为便于对比,将FY-3D逐日轨道亮温转化为与NOAA时空分辨率匹配的月均网格气温。首先,选取FY-3D星下点亮温(即扫描线中央两点平均)以避免扫描角误差,然后按NOAA网格区域将轨道资料进行空间平均,再进行日和月时间平均,得到2019年1月至2024年12月逐月平均全球网格气温资料(简称FY-3D)。选取与NOAA中心频率相同的9个通道气温开展对比(FY-3D 在2021年11月缺测,NOAA 通道9/11/12/13/14/15在2024年8—12月缺测)。通过面积加权将网格气温转化为全球、海洋和陆地等区域月平均气温和距平(气候基准态取2019—2023年平均,月值和气候态的差值即为距平)。参考GCOS气候基本变量观测需求稳定性评估指标[18,22],通过FY-3D与NOAA距平差值趋势的绝对值评估FY-3D气温稳定性,绝对值越小代表观测稳定性越高,越大代表观测越不稳定(后文省略绝对值)。稳定性阈值随通道高度变化,其中对流中上层通道4/6/7和平流层下层通道8/9稳定性阈值为0.05 K/(10 a),平流层中上层通道10~13稳定性阈值为0.10 K/(10 a)(表1)。
2 结果分析
2.1 卫星过赤道时刻变化
FY-3D卫星抬升轨道过赤道时刻(LECT)变化显示(图1),2019—2020年间LECT保持基本稳定(2019年平均值为13꞉30,2020年均累计后移0.7 min),但自2021年起出现明显轨道漂移,后移时间逐步增大(2021—2024年这四年分别为8.3、20.6、37.9和63.6 min)。至2024年12月,累计漂移量达78 min。作为对比,风云三号E星(FY-3E,2021年7月发射,2022年12月起投入业务运行)抬升轨道LECT虽存在小幅波动,但整体保持稳定(图1橙线)。参考NOAA系列卫星中SNPP星(2011年发射),其LECT保持稳定,10年间的漂移量<10 min[22]。
图1
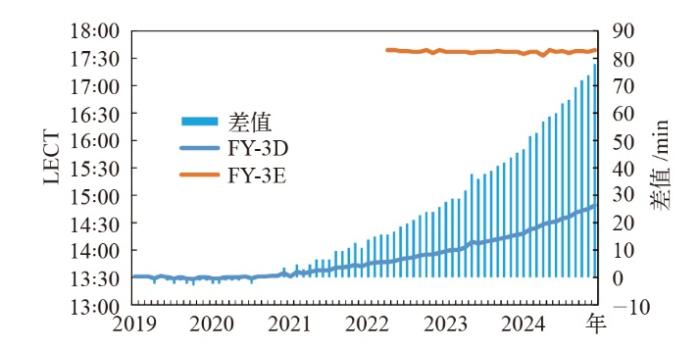
图1
FY-3D 和 FY-3E抬升轨道月均过赤道时刻(LECT)及FY-3D LECT与2019年1月LECT逐月差值
Fig. 1
Monthly mean Ascending Local Equator Crossing Time (LECT) for the FY-3D and FY-3E satellites from 2019 to 2024, along with the FY-3D LECT differences relative to its January 2019
太阳同步轨道卫星的LECT的稳定性对观测数据的可比性具有决定性影响:LECT保持不变,意味着对同一地区的重复观测在基本一致的太阳高度角和光照强度下进行。当LECT出现漂移时,同一地区多次观测时间发生变化,太阳光照条件出现差异,由此引入的采样时间偏差,对不同通道气温观测的影响有所不同,即日变化误差效应。研究表明[25],对流层中层通道4海洋上空、对流层上层至平流层下层通道6~9气温日变化误差效应可忽略;对流层中层通道4陆地上空和平流层中上层通道10~13气温观测则存在显著的日变化误差效应。卫星气温观测在气候领域应用时,需要考虑这种通道和区域差异特性,并采取针对性的误差校正措施。
日变化误差和定标误差漂移是引发卫星气温观测不稳定的主要来源[6,23,25],两者可能同时存在。判定卫星观测气温稳定需要同时满足两个条件:(1)日变化误差可忽略;(2)观测与参照的差值趋势小于稳定性阈值。当日变化误差可忽略时,可通过观测值与参照值的差值趋势来判断定标误差漂移存在与否:若差值趋势超过稳定性阈值,表明存在定标误差漂移,需在气候应用前予以修正;反之则说明观测定标稳定,可直接用于气候研究。然而,当日变化误差较大时,仅凭差值趋势无法准确判断定标误差漂移的存在,较小的差值趋势可能是定标误差漂移与日变化误差相互抵消的结果。因此,在此情况下,必须首先对日变化误差进行修正,然后再评估定标稳定性。
2.2 稳定性评估
图2
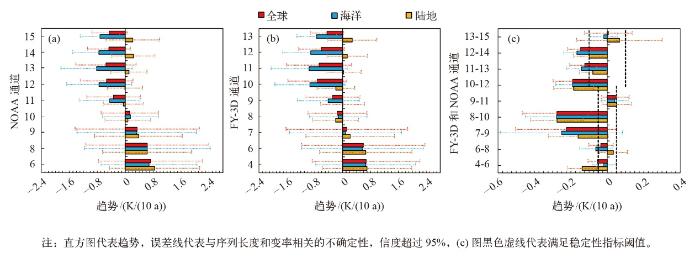
图2
2019—2024年NOAA (a)和FY-3D (b) 9个通道全球、海洋和陆地气温变化趋势对比及两者差值变化趋势(c)
注:直方图代表趋势,误差线代表与序列长度和变率相关的不确定性,信度超过95%,(c)图黑色虚线代表满足稳定性指标阈值。
Fig. 2
Trends of mean-layer temperature anomalies during 2019-2024 for the 9 channels analyzed in this study, averaged over the globe, ocean, and land for NOAA (a), FY-3D (b), and their differences (c). (The bars represent trends with error bars superimposed on them. The trend uncertainty represents 95% confidence intervals with autocorrelation adjustments, which account for time length limitations and temporal variability. The black dashed lines in (c) represent the stability thresholds for the 9 channels)
图3
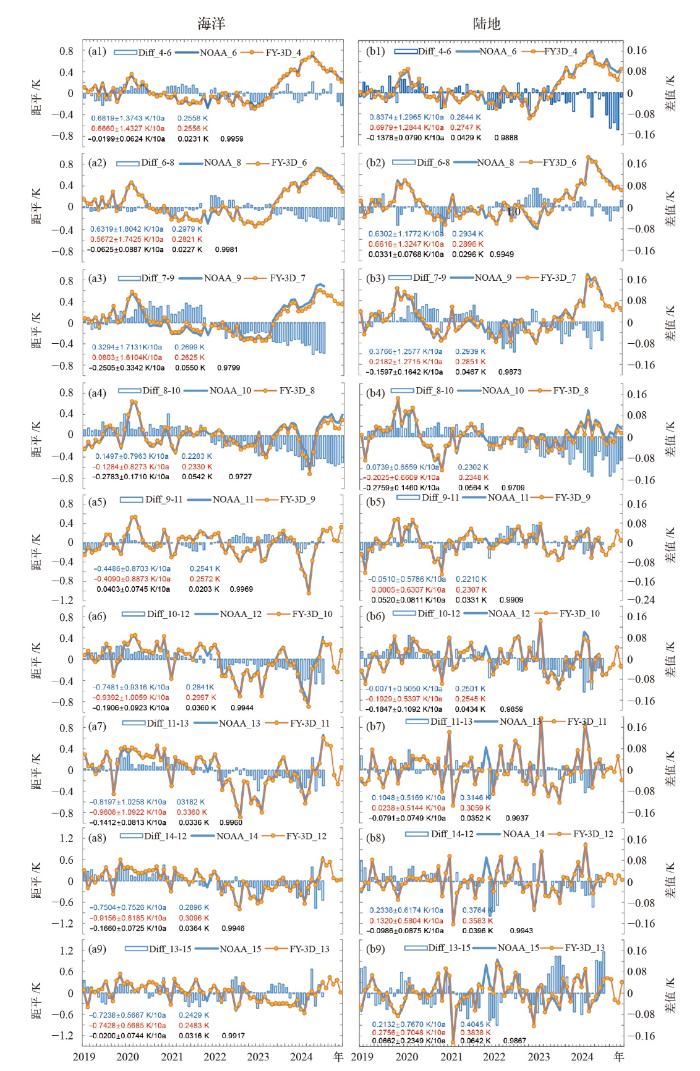
图3
2019—2024年FY-3D和NOAA 9个通道月平均全球海洋(a)和陆地(b)气温距平和差值序列
注:图例中的数字代表通道,例如(a1)图中FY-3D_4代表FY-3D通道4气温距平,NOAA_6代表NOAA通道6气温距平,Diff_4-6代表FY-3D通道4与NOAA通道6的气温距平差值;距平为月平均气温与2019—2023年平均气温的差值;图里数字标注自左至右分别为变化趋势、标准差和相关系数,其中蓝色为NOAA值,红色为FY-3D值,黑色为两者之差或相关值。
Fig. 3
Monthly temperature anomaly time series from 2019 to 2024 for FY-3D and NOAA, and their differences, averaged over the ocean (a) and land (b). (Anomalies are calculated as departures from the 2019-2024 base period. The labels in each panel from left to right represent linear trend and uncertainty, standard deviation, and correlation coefficient, respectively. Blue represents NOAA, red represents FY-3D, and black represents their difference or correlation)
FY-3D与NOAA 9个通道的气温距平差值趋势(图2c)显示,全球尺度上,对流层中层(FY-3D通道4)、对流层上层(FY-3D通道6)、平流层下层(FY-3D通道9)和平流层上层(FY-3D通道13)差值趋势小于或接近稳定性阈值。值得注意的是,对流层中层通道4表现出明显的海陆差异:海洋差值趋势较小(0.02 K/(10 a)),Zou等[6]和Mears等[8]指出对流层中层(FY-3D通道4)海洋上空气温受日变化影响较小,其较小的差值趋势表明该通道定标稳定性达到气候变化研究要求;而陆地区域差值趋势达-0.14 K/(10 a),显著超出阈值范围。陆地上空气温观测定标不稳定与LECT漂移引发的气温日变化误差有关。受海陆热力差异影响,陆地上空气温日变化较大[6],LECT漂移造成的采样时间偏差对陆地上空气温观测的影响远大于海洋。FY-3D通道4气温距平差值序列进一步证实陆地上空气温较不稳定(图3 a1, b1),海洋差值在零线附近随机波动,而陆地差值随LECT漂移呈现系统性负偏差且幅度逐渐增大。全球逐网格FY-3D与NOAA气温均方根误差(RMSE)空间分布同样也反映出显著的海陆差异,非洲北部沙漠和南部高原、南美洲中西部高山和青藏高原等区域RMSE达到1 K以上(图4)。因此,对流层中层(FY-3D通道4)陆地上空气温需要进行日变化误差订正,而无需定标误差漂移订正。对流层上层(FY-3D通道6)和平流层下层(FY-3D通道9)气温观测受日变化影响较小[25],其趋势差值接近或小于稳定性阈值,表明该通道定标稳定性达到气候应用要求,原则上不需要再定标或进行日变化订正。平流层上层(FY-3D通道13)受日变化影响较大,尽管差值趋势较小,仍不能推得其定标稳定,更大的可能是日变化误差和定标误差漂移相互抵消的结果,需先修正日变化误差再进行定标稳定性评估。
图4
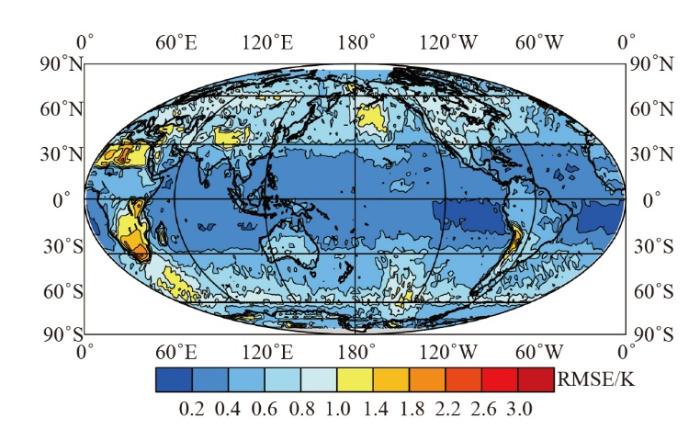
图4
2019—2024年FY-3D通道4与NOAA通道6气温均方根误差空间分布
Fig. 4
Spatial distribution of temperature RMSE between FY-3D channel 4 and NOAA channel 6 during 2019-2024
对流层上层通道7和平流层下层(FY-3D通道8)日变化影响可忽略,但是全球、海洋和陆地区域气温差值趋势均远超稳定性阈值,海洋和陆地逐月差值显示2022—2024年负差值明显增多(图3a3, b3, a4, b4),说明这两个通道存在明显定标误差漂移,气候应用前需要再定标修正。平流层中上层(FY-3D通道10、11和12)气温日变化较大,差值趋势远超稳定性阈值,无法推断大的差值趋势来自日变化误差还是定标误差漂移,需先修正日变化误差后再评估定标稳定性。
综上,稳定性评估为气候变化研究筛选了高信度风云卫星温度观测资料,不稳定的归因为日变化误差或定标误差漂移检测和订正提供了关键依据,为构建均一化风云卫星气温资料集奠定数据及方法基础。
3 结论与展望
从气候变化应用角度出发,参考全球气候观测系统基本气候变量观测要求(GCOS-245)中气温稳定性评估指标,采用NOAA均一化大气温度气候资料集作为参照基准,通过全球、海洋和陆地等区域气温距平对比及差值趋势分析,系统评估了风云三号D星(FY-3D)2019—2024年业务观测气温资料的稳定性。评估过程中考虑了FY-3D轨道漂移引发的日变化误差对全球不同区域(海洋或陆地)各通道气温观测的影响,确立了气候变化应用稳定性判定标准(即气温日变化误差可忽略,且观测与参照序列的差值趋势绝对值小于稳定性阈值)。评估结论如下:
(1)对流层中层通道4海洋上空、对流层上层通道6和平流层下层通道9气温日变化误差可忽略,与参照差值趋势接近或小于稳定性阈值,定标稳定性达到气候变化应用要求,不需要进行日变化误差和定标误差漂移订正,可直接用于全球尺度气温趋势研究。对流层中层通道4陆地上空气温存在显著日变化误差,需要进行日变化误差订正,无需定标误差漂移订正。
(2)对流层上层通道7和平流层下层通道8气温日变化误差可忽略,差值趋势均远超稳定性阈值,说明存在明显定标误差漂移,气候应用前需要订正定标误差漂移。
(3)平流层中上层通道10、11、12和13气温日变化误差较大,其中通道10、11和12差值趋势远超稳定性阈值,无法推断不稳定源自日变化误差还是定标误差漂移;通道13差值趋势较小,不能排除是日变化误差和定标误差漂移相互抵消的结果。因此,通道10、11、12和13观测需订正日变化误差后再开展定标稳定性评估。
致谢
感谢中国气象局国家卫星气象中心提供风云三号D星微波温度计业务观测气温1级数据,感谢美国国家海洋大气管理局提供NOAA卫星均一化气温全球网格气候数据集。
参考文献
Spurious trends in satellite MSU temperatures from merging different satellite records
[J].DOI:10.1038/386164a0 [本文引用: 1]
Recalibration of microwave sounding unit for climate studies using simultaneous nadir overpasses
[J].
Mid-tropospheric layer temperature record derived from satellite microwave sounder observations with backward merging approach
[J].
A reanalysis of the MSU channel 2 tropospheric temperature record
[J].DOI:10.1175/1520-0442(2003)016<3650:AROTMC>2.0.CO;2 URL [本文引用: 1]
Sensitivity of satellite-derived tropospheric temperature trends to the diurnal cycle adjustment
[J].
DOI:10.1175/JCLI-D-15-0744.1
URL
[本文引用: 2]

Temperature sounding microwave radiometers flown on polar-orbiting weather satellites provide a long-term, global-scale record of upper-atmosphere temperatures, beginning in late 1978 and continuing to the present. The focus of this paper is the midtropospheric measurements made by the Microwave Sounding Unit (MSU) channel 2 and the Advanced Microwave Sounding Unit (AMSU) channel 5. Previous versions of the Remote Sensing Systems (RSS) dataset have used a diurnal climatology derived from general circulation model output to remove the effects of drifting local measurement time. This paper presents evidence that this previous method is not sufficiently accurate and presents several alternative methods to optimize these adjustments using information from the satellite measurements themselves. These are used to construct a number of candidate climate data records using measurements from 15 MSU and AMSU satellites. The new methods result in improved agreement between measurements made by different satellites at the same time. A method is chosen based on an optimized second harmonic adjustment to produce a new version of the RSS dataset, version 4.0. The new dataset shows substantially increased global-scale warming relative to the previous version of the dataset, particularly after 1998. The new dataset shows more warming than most other midtropospheric data records constructed from the same set of satellites. It is also shown that the new dataset is consistent with long-term changes in total column water vapor over the tropical oceans, lending support to its long-term accuracy.
Precision and radiosonde validation of satellite grid point temperature anomalies. Part I: MSU channel 2
[J].DOI:10.1175/1520-0442(1992)005<0847:PARVOS>2.0.CO;2 URL [本文引用: 1]
UAH version 6 global satellite temperature products: methodology and results
[J].DOI:10.1007/s13143-017-0010-y URL [本文引用: 1]
Observed temperature changes in the troposphere and stratosphere from 1979 to 2018
[J].
DOI:10.1175/JCLI-D-19-0998.1
[本文引用: 1]
Temperature observations of the upper-air atmosphere are now available for more than 40 years from both ground- and satellite-based observing systems. Recent years have seen substantial improvements in reducing long-standing discrepancies among datasets through major reprocessing efforts. The advent of radio occultation (RO) observations in 2001 has led to further improvements in vertically resolved temperature measurements, enabling a detailed analysis of upper-troposphere/lower-stratosphere trends. This paper presents the current state of atmospheric temperature trends from the latest available observational records. We analyze observations from merged operational satellite measurements, radiosondes, lidars, and RO, spanning a vertical range from the lower troposphere to the upper stratosphere. The focus is on assessing climate trends and on identifying the degree of consistency among the observational systems. The results show a robust cooling of the stratosphere of about 1-3 K, and a robust warming of the troposphere of about 0.6-0.8 K over the last four decades (1979-2018). Consistent results are found between the satellite-based layer-average temperatures and vertically resolved radiosonde records. The overall latitude-altitude trend patterns are consistent between RO and radiosonde records. Significant warming of the troposphere is evident in the RO measurements available after 2001, with trends of 0.25-0.35 K per decade. Amplified warming in the tropical upper-troposphere compared to surface trends for 2002-18 is found based on RO and radiosonde records, in approximate agreement with moist adiabatic lapse rate theory. The consistency of trend results from the latest upper-air datasets will help to improve understanding of climate changes and their drivers.
The long-term trend of upper-air temperature in China derived from microwave sounding data and its comparison with radiosonde observations
[J].
DOI:10.1175/JCLI-D-19-0742.1
URL
[本文引用: 1]
Currently, the satellite Microwave Sounding Unit (MSU/AMSU) datasets developed from three organizations—Remote Sensing Systems (RSS), the University of Alabama at Huntsville (UAH), and the NOAA Center for Satellite Applications and Research (STAR)—are often used to monitor the global long-term trends of temperatures in the lower troposphere (TLT), midtroposphere (TMT), total troposphere (TTT), troposphere and stratosphere (TTS), and lower stratosphere (TLS). However, the trend in these temperatures over China has not been quantitatively assessed. In this study, the decadal variability and long-term trend of upper-air temperature during 1979–2018 from three MSU datasets are first evaluated over China and compared with the proxy MSU dataset simulated from homogenized surface and radiosonde profiles (EQU) at 113 stations in China. The regional mean MSU trends over China during 1979–2018 are 0.22–0.27 (TLT), 0.15–0.22 (TMT), 0.20–0.27 (TTT), 0.02–0.14 (TTS), and from −0.33 to −0.36 (TLS) K decade−1, whereas the EQU trends are 0.31 (TLT), 0.19 (TMT), 0.24 (TTT), 0.07 (TTS), and −0.26 (TLS) K decade−1. The trends from RSS generally show a better agreement with those from EQU. The trends from both MSU and EQU exhibit seasonal and regional difference with a larger warming in TLT in February and March, and stronger cooling in TLS from late winter to spring. The TLT and TMT over the Tibetan Plateau and northwestern China show larger warming trends. The variability from MSU and EQU agree well except TLT in Tibet and southern China. The major difference in regional mean temperatures over China between MSU and EQU is related primarily to the satellite instrument changes during 1979–98 and the radiosonde system changes in China in the 2000s.
Comparing tropospheric warming in climate models and satellite data
[J].
DOI:10.1175/JCLI-D-16-0333.1
URL
[本文引用: 1]
Updated and improved satellite retrievals of the temperature of the mid-to-upper troposphere (TMT) are used to address key questions about the size and significance of TMT trends, agreement with model-derived TMT values, and whether models and satellite data show similar vertical profiles of warming. A recent study claimed that TMT trends over 1979 and 2015 are 3 times larger in climate models than in satellite data but did not correct for the contribution TMT trends receive from stratospheric cooling. Here, it is shown that the average ratio of modeled and observed TMT trends is sensitive to both satellite data uncertainties and model–data differences in stratospheric cooling. When the impact of lower-stratospheric cooling on TMT is accounted for, and when the most recent versions of satellite datasets are used, the previously claimed ratio of three between simulated and observed near-global TMT trends is reduced to approximately 1.7. Next, the validity of the statement that satellite data show no significant tropospheric warming over the last 18 years is assessed. This claim is not supported by the current analysis: in five out of six corrected satellite TMT records, significant global-scale tropospheric warming has occurred within the last 18 years. Finally, long-standing concerns are examined regarding discrepancies in modeled and observed vertical profiles of warming in the tropical atmosphere. It is shown that amplification of tropical warming between the lower and mid-to-upper troposphere is now in close agreement in the average of 37 climate models and in one updated satellite record.
Studies of FY-3 observations over the past 10 years: a review
[J].
DOI:10.3390/rs13040673
URL
[本文引用: 1]
With the rapid advances and abundant observations from Chinese Fengyun-3 (FY-3) meteorological satellites, it is of great interest to summarize a decade of quality assessments of FY-3 observations. The topics covered are noise characterization, bias estimation, striping noise detection and mitigation of striping noise, radio frequency interference detection, geolocation accuracy estimation and improvement, data assimilation cloud detection and quality control for observations from the MicroWave Temperature Sounder (MWTS), the MicroWave Humidity Sounder (MWHS), the MicroWave Radiation Imager (MWRI) and the Hyperspectral Infrared Atmospheric Sounder (HIRAS) instruments on board FY-3A/B/C/D. Whether and how much FY-3 data assimilation could improve the numerical weather forecast skill strongly depends on how well the FY-3 data characteristics and errors listed above are known. This review article shall contribute to promoting internal and national usages of FY-3 observations for weather and climate studies.
Fengyun meteorological satellite products for Earth system science applications
[J].
DOI:10.1007/s00376-021-0425-3
[本文引用: 1]
Following the progress of satellite data assimilation in the 1990s, the combination of meteorological satellites and numerical models has changed the way scientists understand the earth. With the evolution of numerical weather prediction models and earth system models, meteorological satellites will play a more important role in earth sciences in the future. As part of the space-based infrastructure, the Fengyun (FY) meteorological satellites have contributed to earth science sustainability studies through an open data policy and stable data quality since the first launch of the FY-1A satellite in 1988. The capability of earth system monitoring was greatly enhanced after the second-generation polar orbiting FY-3 satellites and geostationary orbiting FY-4 satellites were developed. Meanwhile, the quality of the products generated from the FY-3 and FY-4 satellites is comparable to the well-known MODIS products. FY satellite data has been utilized broadly in weather forecasting, climate and climate change investigations, environmental disaster monitoring, etc. This article reviews the instruments mounted on the FY satellites. Sensor-dependent level 1 products (radiance data) and inversion algorithm-dependent level 2 products (geophysical parameters) are introduced. As an example, some typical geophysical parameters, such as wildfires, lightning, vegetation indices, aerosol products, soil moisture, and precipitation estimation have been demonstrated and validated by in-situ observations and other well-known satellite products. To help users access the FY products, a set of data sharing systems has been developed and operated. The newly developed data sharing system based on cloud technology has been illustrated to improve the efficiency of data delivery.
风云三号卫星微波载荷历史数据再定标
[J].
Recalibration of the FY-3 microwave payload historical data records
[J].DOI:10.11834/jrs.20221436 URL [本文引用: 2]
风云三号微波温度计长序列再定标历史数据集质量评估
[J].
Quality assessment of the long-term recalibration history dataset of the FY-3 microwave temperature sounder
[J].
Insights into the microwave instruments onboard the Fengyun 3D satellite: data quality and assimilation in the Met Office NWP system
[J].
DOI:10.1007/s00376-020-0010-1
[本文引用: 1]
This paper evaluates the microwave instruments onboard the latest Chinese polar-orbiting satellite, Feng-Yun 3D (FY-3D). Comparing three months of observations from the Microwave Temperature Sounder 2 (MWTS-2), the Microwave Humidity Sounder 2 (MWHS-2), and the Microwave Radiation Imager (MWRI) to Met Office short-range forecasts, we characterize the instrumental biases, show how those biases have changed with respect to their predecessors onboard FY-3C, and how they compare to the Advanced Technology Microwave Sounder (ATMS) onboard NOAA-20 and the Global Precipitation Measurement Microwave Imager (GMI). The MWTS-2 global bias is much reduced with respect to its predecessor and compares well to ATMS at equivalent channel frequencies, differing only by 0.36 ± 0.28 K (1σ) on average. A suboptimal averaging of raw digital counts is found to cause an increase in striping noise and an ascending—descending bias. MWHS-2 benefits from a new calibration method improving the 183-GHz humidity channels with respect to its predecessor and biases for these channels are within ± 1.9 K to ATMS. MWRI presents the largest improvements, with reduced global bias and standard deviation with respect to FY-3C; although, spurious, seemingly transient, brightness temperatures have been detected in the observations at 36.5 GHz (vertical polarization). The strong solar-dependent bias that affects the instrument on FY-3C has been reduced to less than 0.2 K on average for FY-3D MWRI. Experiments where radiances from these instruments were assimilated on top of a full global system demonstrated a neutral to positive impact on the forecasts, as well as on the fit to the background of independent instruments.
风云三号A星大气探测资料数据在欧洲中期天气预报中心的初步评价与同化研究
[J].
Initial evaluation and assimilation of FY-3A atmospheric sounding data in the ECMWF System
[J].
用GPS资料对风云三号微波温度计资料进行绝对校准
[J].
Absolute calibration of MWTS sounding channels using GPS RO data
[J].
New generation of U.S. satellite microwave sounder achieves high radiometric stability performance for reliable climate change detection
[J].
Post-millennium atmospheric temperature trends observed by satellites on stable orbits
[J].
Inter-satellite calibration of AMSU-A observations for weather and climate applications
[J].
Examination of space-based bulk atmospheric temperatures used in climate research
[J].DOI:10.1080/01431161.2018.1444293 URL [本文引用: 1]
Variational bias correction of satellite radiance data in the ERA-Interim reanalysis
[J].DOI:10.1002/qj.v135:644 URL [本文引用: 1]
A climate data record of atmospheric moisture and sea surface temperature from satellite observations
[J].
