风云三号D星气温观测气候变化应用稳定性评估
Evaluation of temporal stability in atmospheric temperature observations from FengYun-3D satellite for climate change research
注:直方图代表趋势,误差线代表与序列长度和变率相关的不确定性,信度超过95%,(c)图黑色虚线代表满足稳定性指标阈值。
风云三号D星气温观测气候变化应用稳定性评估 |
| 郭艳君, 邹成智 |
|
Evaluation of temporal stability in atmospheric temperature observations from FengYun-3D satellite for climate change research |
| GUO Yan-Jun, ZOU Cheng-Zhi |
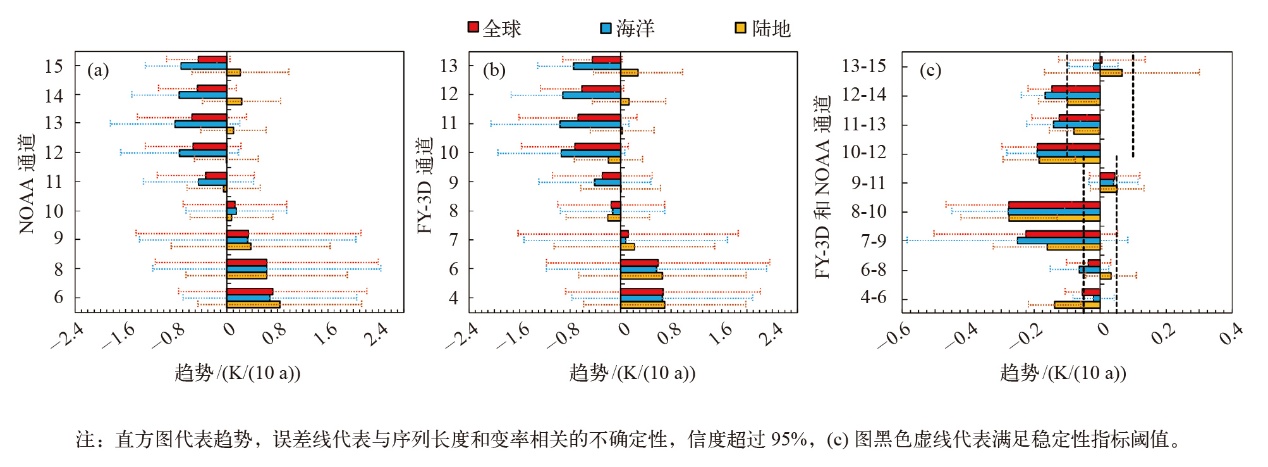
| 图2 2019—2024年NOAA (a)和FY-3D (b) 9个通道全球、海洋和陆地气温变化趋势对比及两者差值变化趋势(c) 注:直方图代表趋势,误差线代表与序列长度和变率相关的不确定性,信度超过95%,(c)图黑色虚线代表满足稳定性指标阈值。 |
| Fig. 2 Trends of mean-layer temperature anomalies during 2019-2024 for the 9 channels analyzed in this study, averaged over the globe, ocean, and land for NOAA (a), FY-3D (b), and their differences (c). (The bars represent trends with error bars superimposed on them. The trend uncertainty represents 95% confidence intervals with autocorrelation adjustments, which account for time length limitations and temporal variability. The black dashed lines in (c) represent the stability thresholds for the 9 channels) |
|
|