风云三号D星气温观测气候变化应用稳定性评估
郭艳君, 邹成智

Evaluation of temporal stability in atmospheric temperature observations from FengYun-3D satellite for climate change research
GUO Yan-Jun, ZOU Cheng-Zhi
图3 2019—2024年FY-3D和NOAA 9个通道月平均全球海洋(a)和陆地(b)气温距平和差值序列
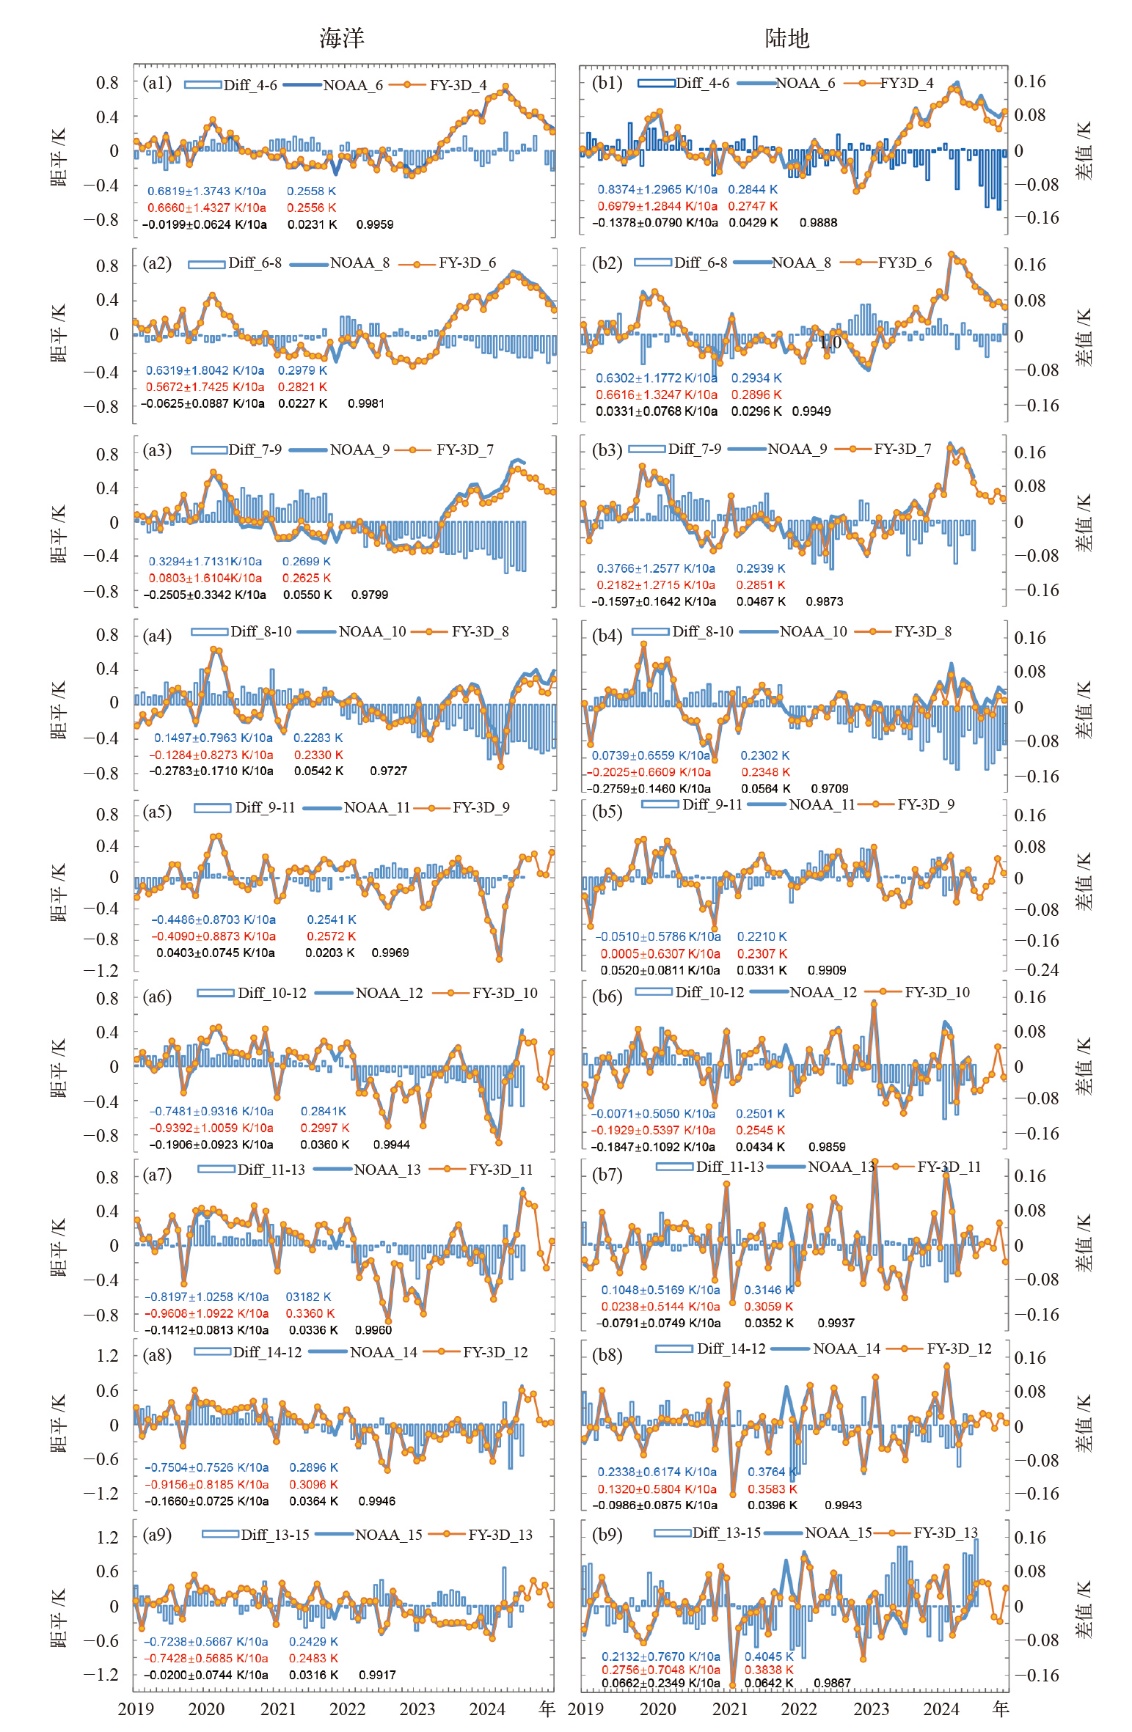
注:图例中的数字代表通道,例如(a1)图中FY-3D_4代表FY-3D通道4气温距平,NOAA_6代表NOAA通道6气温距平,Diff_4-6代表FY-3D通道4与NOAA通道6的气温距平差值;距平为月平均气温与2019—2023年平均气温的差值;图里数字标注自左至右分别为变化趋势、标准差和相关系数,其中蓝色为NOAA值,红色为FY-3D值,黑色为两者之差或相关值。
Fig. 3 Monthly temperature anomaly time series from 2019 to 2024 for FY-3D and NOAA, and their differences, averaged over the ocean (a) and land (b). (Anomalies are calculated as departures from the 2019-2024 base period. The labels in each panel from left to right represent linear trend and uncertainty, standard deviation, and correlation coefficient, respectively. Blue represents NOAA, red represents FY-3D, and black represents their difference or correlation)