Climate Change Research ›› 2020, Vol. 16 ›› Issue (3): 276-286.doi: 10.12006/j.issn.1673-1719.2019.050
• Changes in Climate System • Previous Articles Next Articles
Projection of extreme precipitation in the Hanjiang River basin under different RCP scenarios
Qi-Mou ZHANG1,2,Run WANG1,2( ),Tong JIANG3,4,Song-Sheng CHEN5
- 1 School of Resource and Environmental Science, Hubei University, Wuhan 430062, China
2 Water Resource Management & Policy Research Center, Hubei University, Wuhan 430062, China
3 National Climate Center, China Meteorological Administration, Beijing 100081, China
4 Collaborative Innovation Center on Forecast and Evaluation of Meteorological Disasters/Institute for Disaster Risk Management/School of Geographic Sciences, Nanjing University of Information Science &Technology, Nanjing 210044, China
5 Bureau of Hydrology, Changjiang Water Resources Commission, Wuhan 430010, China
-
Received:2019-03-08Revised:2019-05-31Online:2020-05-30Published:2020-06-15 -
Contact:Run WANG E-mail:rwang@hubu.edu.cn
Cite this article
Qi-Mou ZHANG,Run WANG,Tong JIANG,Song-Sheng CHEN. Projection of extreme precipitation in the Hanjiang River basin under different RCP scenarios[J]. Climate Change Research, 2020, 16(3): 276-286.
share this article
Add to citation manager EndNote|Ris|BibTeX
URL: http://www.climatechange.cn/EN/10.12006/j.issn.1673-1719.2019.050
 |
Table 1 The description of 5 CMIP5 models used in this study
| |
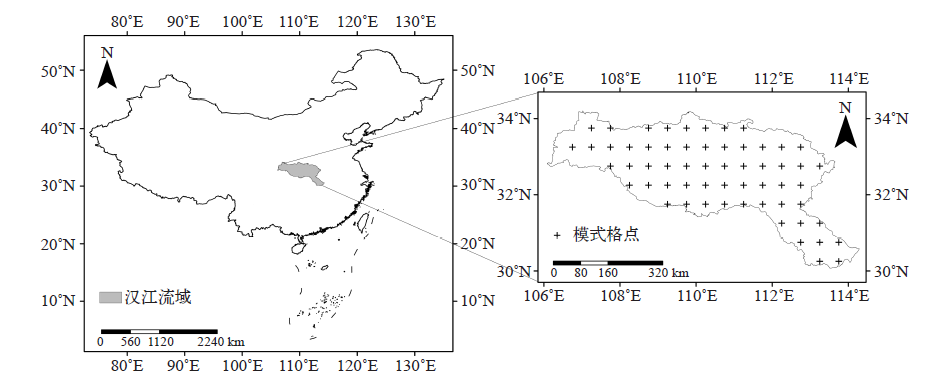
Fig. 1 Location of the Hanjiang River basin and distribution of model grids
 |
Table 2 Definition of extreme precipitation indices in this study
| |
 |
Table 3 Simulation performance of 5 CMIP5 models for extreme precipitation indices in the Hanjiang River basin
| |
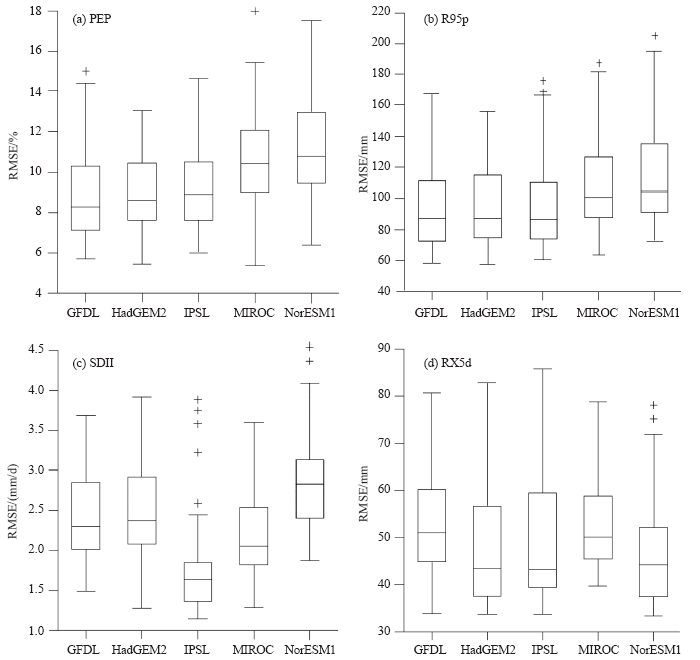
Fig. 2 Boxplots of RMSE of extreme precipitation indices in 59 grids of the Hanjiang River basin in the period of 1961-2005
 |
Table 4 Spatial correlation of extreme precipitation indices in Hanjiang River basin for 1961-2005
| |

Fig. 3 Extreme precipitation indices change in the period of 2016-2060 in the Hanjiang River basin

Fig. 4 Spatial distribution of change ratio of 4 extreme precipitation indices in the Hanjiang River basin during 2016-2060 under 3 RCPs
 |
Table 5 The projection range and uncertainty analysis of extreme precipitation in 5 modelsunder different RCP scenarios
| |

Fig. 5 Spatial distribution of standard deviations of 4 extreme precipitation indices in Hanjiang River basin during 2016-2060 under 3 RCPs
|
| [1] | XU Li,LI Qian,WANG Ying,HUANG Jing-Ling,XU Ying-Jun. Analysis of the changes in debris flow hazard in the context of climate change [J]. Climate Change Research, 2020, 16(4): 415-423. |
| [2] | DING Kai-Xi,ZHANG Li-Ping,SHE Dun-Xian,ZHANG Qin,XIANG Jun-Wen. Variation of extreme precipitation in Lancang River basin under global warming of 1.5℃ and 2.0℃ [J]. Climate Change Research, 2020, 16(4): 466-479. |
| [3] | Hong YIN,Ying SUN. Characteristics of extreme temperature and precipitation in China in 2017 based on ETCCDI indices [J]. Climate Change Research, 2019, 15(4): 363-373. |
| [4] | Qian-Yu ZHA,Chao GAO,Ru YANG,Yue LIU,Tian RUAN,Peng LI. Study on runoff under global warming of 1.5℃ and 2.0℃ in main stream of upper reaches of the Huaihe River [J]. Climate Change Research, 2018, 14(6): 583-592. |
| [5] | Cui HAN,Yi-Xing YIN,Yi-Han HUANG,Meng-Yang LIU,Xiao-Jun WANG. Variation characteristics and influencing factors of extreme precipitation in the Meiyu area of Yangtze-Huai River Basin during 1960-2014 [J]. Climate Change Research, 2018, 14(5): 445-454. |
| [6] | Bing-Rui HE,Pan-Mao ZHAI. Characteristics of the persistent and non-persistent extreme precipitation in China from 1961 to 2016 [J]. Climate Change Research, 2018, 14(5): 437-444. |
| [7] | Rui-Qiang YUAN, Ya-Nan WANG, Peng WANG, Shi-Qin WANG, Yu-Hong CHEN. An analysis of precipitation concentration variation characteristics and influential factors in Shanxi province, China [J]. Climate Change Research, 2018, 14(1): 11-20. |
| [8] | Zhang Dongfeng, Han Zhenyu, Shi Ying. Comparison of Climate Projection Between the Driving CSIRO-Mk3.6.0 and the Downscaling Simulation of RegCM4.4 over China [J]. Climate Change Research, 2017, 13(6): 557-568. |
| [9] | Zhang Xinyi, Fang Guohua, Wen Xin, Ye Jian, Guo Yuxue. Statistical Model and Threshold Value Selection of Gridded Daily Precipitation Extremes in China [J]. Climate Change Research, 2017, 13(4): 346-355. |
| [10] | Xu Ying, Zhou Botao, Wu Jie, Han Zhenyu, Zhang Yongxiang, Wu Jia. Asian Climate Change in Response to Four Global Warming Targets [J]. Climate Change Research, 2017, 13(4): 306-315. |
| [11] | Liang Ju, Liang Jun, Yong Yangyang. Climatology of the Extreme Precipitation Events over Guangxi Province andIts Potential Responses to ENSO [J]. Climate Change Research, 2017, 13(2): 117-127. |
| [12] | Zhang Yanwu, Zhang Li, Xu Ying . Simulations and Projections of the Surface Air Temperature in China by CMIP5 Models [J]. Climate Change Research, 2016, 12(1): 10-19. |
| [13] | Zeng Yingting, Lu Er. Changes of Summer Rainfall and Extreme Precipitation During 1961-2010 in China [J]. Climate Change Research, 2015, 11(2): 79-85. |
| [14] | Yang Wei, Zhang Liping, Shan Lijie, Chen Xinchi, Yang Yanrong. Spatiotemporal Distribution Features of Extreme Hydrological Events in the Hanjiang River Basin [J]. Climate Change Research, 2015, 11(1): 15-21. |
| [15] | Chen Xiaochen, Xu Ying, Xu Chonghai, Yao Yao. Assessment of Precipitation Simulations in China by CMIP5 Multi-models [J]. Climate Change Research, 2014, 10(3): 217-225. |
| Viewed | ||||||
|
Full text |
|
|||||
|
Abstract |
|
|||||