

引言
水权交易允许水权流向高价值用户,是解决水资源供需不稳定和水量时空分布不均的有效手段[12]。一方面,有学者研究气候变化下水权交易决策,Jiang等[13]借助综合灌溉农业水管理模型探索了气候变化下墨累-达令流域农业灌溉水权配置及土地利用决策方案。另一方面,有学者揭示气候变化下水权交易对水资源系统的影响,Luo等[14]基于随机规划方法分析气候变化对水交易计划长期经济效益的影响,评估水交易作为气候变化适应性策略选项的潜力。现有研究从单一气候变化情景、单一行业的角度探讨水权交易的影响,跨行业水权交易打破行业边界,在缓解多行业缺水、提高区域水资源利用效率上更具优势;其次,在多种共享社会经济路径下衡量水权交易效应,有利于提升气候变化下的适应性。然而,现有研究未能定量揭示气候变化条件下跨行业水权交易的水管理系统效应。
本研究以大沽河流域为研究区,关注气候变化条件下该流域水资源系统中存在的多种复杂性因子。例如,气候变化改变了降雨、蒸发的时空分布,为水文循环带来了复杂影响,这增强了天然径流量的随机性特征;其次,社会经济数据的波动性以及水文资料的不完整性,给水资源适应性管理带来了不确定性;最后,青岛市是沿海经济强市,同时也是以资源型缺水为主要特征的缺水城市,经济发展目标与用水总量控制目标构成了必须统筹兼顾的核心导向,作为青岛市的重要水源地,大沽河流域水资源适应性管理具有经济效益最大化与用水量最小化的多目标特征。
本研究开发了一种多气候变化情景下的随机多目标水权交易决策模型(SMWR-CC),该模型集成气候数据处理、自然径流重建、植被需水量模拟子模块,可用于分析气候变化对流域供需水的影响。模型还集成了不确定性处理子模块,该子模块耦合两阶段随机规划(TSP)、区间规划(IPP)与双层规划(BP)技术,其中,TSP技术能够在目标函数中细致描述随机的天然径流量带来的随机缺水量及其损失,进而实现对水管理决策的追索;IPP技术能够描述SMWR-CC参数的波动范围,将水资源系统数据的不确定性贯穿决策始终;BP技术通过引入满意度实现上、下层目标的嵌套与平衡,进而处理水资源适应性管理的多目标冲突。SMWR-CC精细描述了全流域水质控制、16个河区的水量平衡、社会生产、供水安全和交易规则等实际过程,实现在多种气候情景下的多目标、多区域、多行业、多用户的水权初始配置与再分配,基于决策模型评估“第六次国际耦合模式比较计划”(CMIP6)多情景下跨行业水权交易制度的适应性管理效应,为气候变化下缺水流域水资源适应性管理机制选择与方案制定提供定量依据。
1 研究区域及数据
1.1 研究系统概况
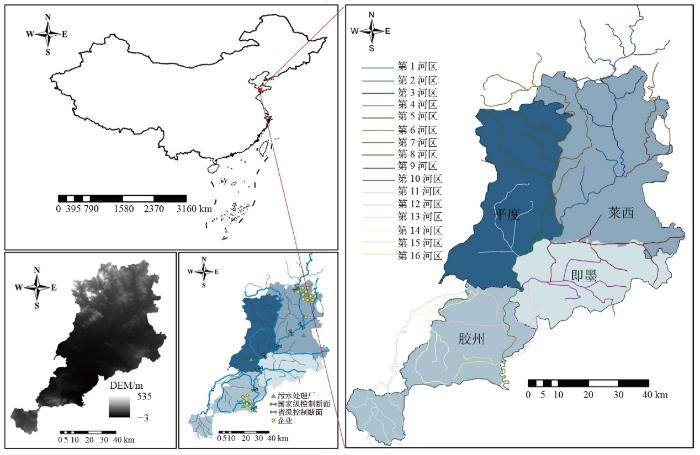
大沽河流域地处119°38′~120°37′E,35°32′ ~37°20′N范围内,起源于烟台市招远市阜山镇,在青岛市境内依次流经莱西、平度、即墨、胶州和崂山,最终于胶州市斜拉桥国控断面注入胶州湾(图1)。大沽河干流全长约179.9 km,总面积为6131.3 km2,青岛市辖区内流域面积为4781.1 km2,占整个流域的77.98%[15]。近20年来,大沽河流域降水年际变化明显,呈现“连续偏多或连续偏少”的特点,降水主要集中在主汛期(7—8月)[16]。根据全国第三次水资源评价成果,青岛人均占有水资源量186 m3,仅为全国平均水平的9.5%,是世界平均水平的2%。该流域是我国北方典型的生态脆弱型农业流域,长期的水资源短缺和生产活动导致生态系统受损,部分河段生态基流难以保障。气候变化条件下大沽河水资源量年际变化加大,水资源供给量具有随机性,而水资源需求量日益增加,这加剧了流域水资源供需矛盾[17];此外,大沽河流域是青岛市主要粮食产区,主要农作物有玉米、小麦、棉花、花生和蔬菜等,农业需水量大,且受到气候变化的显著影响;缺水导致流域生态系统脆弱性问题,气候变化通过影响水资源量与湿地植被蒸发过程带来了湿地退化风险[18]。
图1
1.2 数据资料
气象站历史观测数据来源于国家气象科学数据中心,气候模式模拟数据来源于欧盟哥白尼地球观测计划①(①
2 研究方法
2.1 气象数据处理
因系统偏差和空间分辨率的差异,全球气候模式(GCMs)输出数据无法直接使用,为减少误差,需对数据进行偏差校正[19]。本研究利用线性标度方法对模式输出的气象数据进行偏差校正。计算公式如下:
式中:pcor、Tcor为降水、温度预测数据(包含校准期和验证期);pm、Tm为校正前降水、温度数据(包含校准期和验证期);p—obs、T—obs 为校准期观测降水、温度的均值;p—sim、T—sim 为校准期预测降水、温度的均值;式中降水数据单位均为mm,温度数据单位均为℃。
比较经过偏差校正后的气候模式历史数据集与气象站观测数据集的归一化均方根误差(RMSE)、百分比偏差(PBIAS)及平均差(MD),考虑每个模式(MRI-ESM2-0、INM-CM5-0、INM-MM4-8、MPI-ESM1-2-LR、NORESM-MM)中所有统计指标的值,使用折衷规划指数(CPI)方法对模式进行评分[20],最终选择最优的气候模型,即MRI-ESM2-0。在计算中,RMSE及PBIAS理想值为0、MD理想值为1。
2.2 水资源评价
式中:WNR为水文站控制断面天然径流量;WM为水文站控制断面实测径流量;WA为农业灌溉引用地表水净耗水量;WE为工业引用地表水净耗水量;WF为林牧渔业引用地表水净耗水量;WT为城镇生活用水净耗水量;WR为水库蓄水变量;WRe为水库水面蒸发量和响应陆地蒸发量差值;WD为跨流域引水量(引出为正,引入为负);WFd为河道分洪水量(分出为正,分入为负);Wot为其他径流量;单位均为106 m3/a。采用Pearson III型分布拟合天然径流量时间序列的概率密度函数并计算特征值,获得天然径流量的Pearson III型分布函数及曲线,由水文行业规范划分的5种典型来水年型(特枯水年、枯水年、平水年、丰水年和特丰水年)对应的设计频率标准确定相应频率下的天然径流量。
2.3 农作物需水量计算
本研究使用联合国粮食及农业组织(FAO)推荐的Penman-Monteith方程计算作物需水量Ec,在FAO推荐的作物系数基础上,结合研究区实际情况,以主要作物物候期为依据对作物系数进行了修正,对流域作物灌溉需水量(I)进行估算[23]。表达式为:
式中:Ec为作物需水量;Eo为参考作物蒸散量;Kc为作物系数;Pe为各生长阶段有效降雨量;单位均为mm/d。
2.4 湿地生态需水量计算
2.5 模型构建
本研究开发的决策模型涉及用水户包括大沽河流域种植业、畜牧业和渔业在内的3个农业行业和17家主要企业;空间维度上,基于中国五级子流域划分,流域被划分为16个五级子流域河区,并叠加4个县(莱西、平度、即墨、胶州)的区域边界,形成21个地理分区;模型规划期为2026—2055年,每5年一个规划期,共6个规划期。研究过程涉及特枯水年、枯水年、平水年、丰水年和特丰水年(k = 1、k = 2、k = 3、k = 4、k = 5)5种水文年型;水质控制上考虑5个国家级控制断面和3个省级控制断面的水质目标;模型还将流域内4个主要污水处理厂的处理过程考虑到约束中。模型关注水资源供给过程的天然径流量以及地区主要需水过程中的种植业单位生产规模需水量、单位面积湿地植被需水量对气候变化的响应,以反映气候变化对流域水资源的系统性影响。在综合考虑多种气候变化情景的基础上,基于区间随机双层规划(ISBP)方法,构建多气候变化情景下的随机多目标水权交易决策模型(SMWR-CC)[28]。
此外,本研究还构建无水权交易机制模型,该模型没有水权交易约束。同时,在价格机制、地表水平衡两类约束中不涉及水权交易过程,生产规模、用水量、污染物排放量、监测断面浓度、节水潜力5类约束与随机多目标水权交易决策模型一致。
3 结果与分析
3.1 不同气候变化情景下的流域水资源量
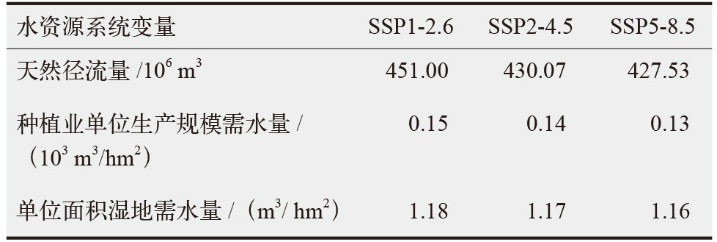
基于MRI-ESM2-0气候模式输出的偏差校正后的未来气候预测结果,SSP1-2.6情景下的日均降雨量最多,比SSP2-4.5、SSP5-8.5情景分别高0.17 mm、0.03 mm;日均温度在SSP5-8.5情景下最高,比SSP1-2.6、SSP2-4.5情景分别高0.52℃、0.26℃;日较差(最高温度与最低温度之差)在SSP1-2.6情景下最高,比SSP2-4.5、SSP5-8.5情景分别高0.01℃、0.15℃。表1展示了多气候变化情景下天然径流量、种植业单位生产规模需水量、单位面积湿地需水量。结果表明,多气候变化情景下天然径流量、种植业单位生产规模需水量、单位面积湿地需水量的排序均为SSP1-2.6>SSP2-4.5>SSP5-8.5,这是因为降雨是天然径流量的直接来源;植物需水量与日较差、风速、饱和水汽压差呈显著正相关。
表1 多气候变化情景下流域天然径流量、种植业单位生产规模需水量、单位面积湿地需水量
Table 1
 |
3.2 缺水量
图2展示了不同来水年型下有、无水权交易机制下的流域总缺水量,其中下界指参数能达到的最小值,上界指参数能达到的最大值。结果显示,与无水权交易情景相比,有水权交易下枯水年份缺水量显著减少,平水年缺水量略有减少,丰水年份缺水量基本保持不变。这是因为,枯水年份,流域天然径流量及用户初始水权分配不充分,导致部分用户缺水量及对水权的需求量较大,促使水权交易发生,以减少缺水量;丰水年份初始水权分配量基本满足各用户生产配水,缺水用户较少。结果还表明,相较于无交易机制,水权交易下SSP5-8.5情景下缺水量显著减少,SSP1-2.6情景下缺水量略有减少,其中SSP1-2.6、SSP2-4.5、SSP5-8.5情景下交易后较交易前分别减少6.37%~7.71%、6.46%~10.56%、7.05%~14.59%。这是因为,在枯水年份,SSP5-8.5情景下较小的天然径流量导致该情景下交易前企业缺水较多,企业缺水损失较高,交易过程中优先购买水权以减少缺水,缺水量显著减少;SSP1-2.6情景下天然径流量较大,从而交易下缺水量略有减少。
图2
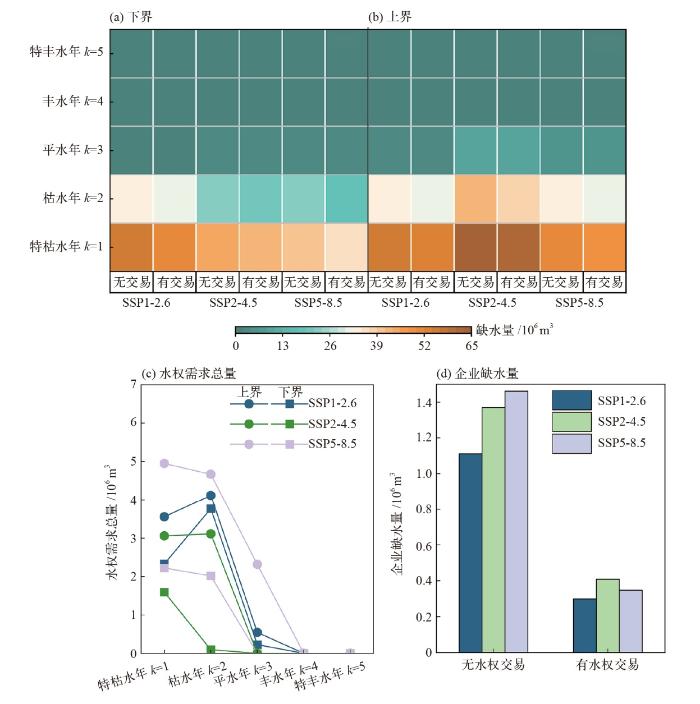
图2
不同机制及多种来水年型下的缺水量
Fig. 2
Water shortage under different mechanisms and various hydrological year types
图3展示了有、无水权交易机制下各行业的缺水量。结果表明,相较于无交易机制,水权交易机制下各行业缺水量均减少,其中企业显著减少,多气候变化情景下平均减少62.61%~80.40%。这是因为水权倾向于流向单位用水效益高的行业,各个行业中企业的单位用水量效益最高。Zhang等[29]也发现由于企业的单位用水量效益最高,企业将成为水权交易过程中的主要买家。种植业、畜牧业及渔业在多气候变化情景下行业缺水量分别减少2.38%~10.69%、2.09%~3.42%及1.57%~2.08%,依次降低,但其中畜牧业单位用水效益高于种植业及渔业。因为水权交易主要发生在枯水年份,在枯水年份水资源短缺、监测断面水质风险高,流域畜牧业与企业生产过程会产生化学需氧量,水权交易机制下企业配水量较多,在水质安全约束导向下畜牧业配水被压缩,所以缺水减少量少于种植业。综上,水权交易市场可以驱动水权从低效益用户转向高效益用户,进而有效地提高水资源的利用效率;通过市场优化配置可以使多余的水权得到高效利用,减少行业缺水量。这与刘美等[30]研究结果一致。
图3
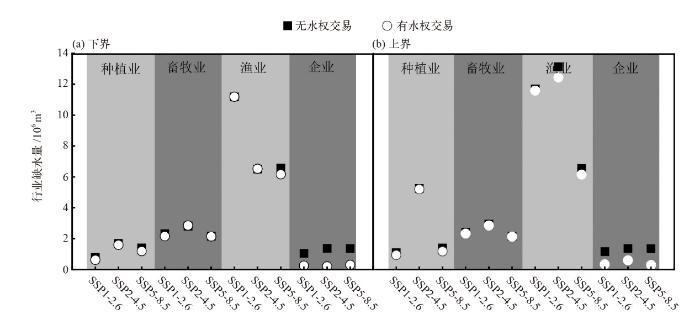
图3
不同机制下各行业缺水量
Fig. 3
Water shortage of various industries under multiple mechanisms
图4展示了有、无水权交易机制下各河区的缺水量(水权交易量为正值指河区以买入水权为主;水权交易量为负值指河区以卖出水权为主)。其中,多种气候变化情景下71%的河区缺水量减少,这是由于,水权买卖可以通过水权流通将水资源丰富地区的水量调配至水资源匮乏的地区,进而减少地区缺水量。29%的河区(如第5河区)缺水量增多,这是因为这些河区卖出水权导致实际用水减少,缺水增多。可通过采用高效节水技术、强化总量管控与节水补贴机制,减少水权交易对部分河区的负面效应。另外,图5展示了有、无水权交易机制下各县区的缺水量,相较于无交易机制,水权交易机制下莱西、平度、即墨、胶州4个县的缺水均有所减少,其中莱西缺水量显著减少,多气候变化情景下缺水量平均减少6.90%~10.91%。这是因为,根据流域实际情况,莱西种植业单位生产规模用水量较大,农业耗水量较大,导致该县交易前企业缺水较多,交易后企业缺水量明显减少。上述结果暗示,气候变化下水权可以使水资源丰富的地区转让多余的水,实现水资源的空间调配,减少系统缺水量,优化水资源的空间分布。
图4
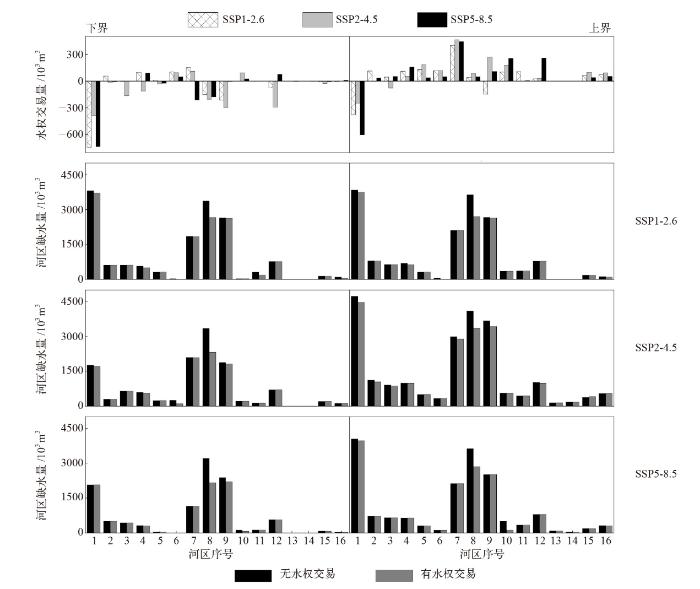
图4
不同机制下各河区的缺水量
Fig. 4
Water shortage in each river region under different mechanisms
图5
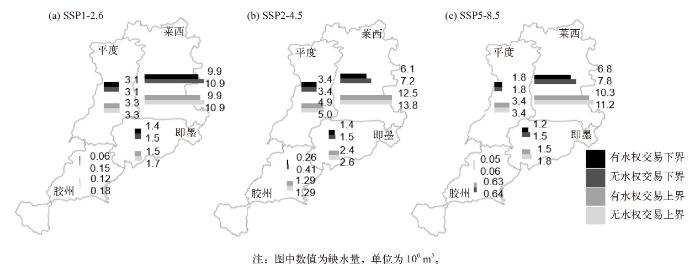
图5
不同机制下各县区的缺水量
注:图中数值为缺水量,单位为106 m3。
Fig. 5
Water shortage in each county under different mechanisms
3.3 系统供水量、效益、效率
图6显示了有、无水权交易机制下的系统供水总量,其中,交易机制比非交易机制系统供水总量有所增加,具体地,多气候变化情景平均增加0.72%~0.90%,即1.12×10⁶~1.40×10⁶ m3/a。这是由于在水权交易中单位用水效益高的用户持有水权量增多,如图7,提高的水权利用率带来较高的供水量。结果还表明,SSP1-2.6、SSP2-4.5、SSP5-8.5情景下水权交易机制带来供水总量提升幅度依次增大,分别为0.66%~0.76%、0.85% ~0.96%、0.90%~1.08%。这是因为交易过程使SSP5-8.5情景下缺水量显著减少,因此系统供水总量增加最多。水权交易机制下SSP1-2.6情景的系统供水总量最多,比SSP2-4.5情景多2.96%~3.65%。
图6
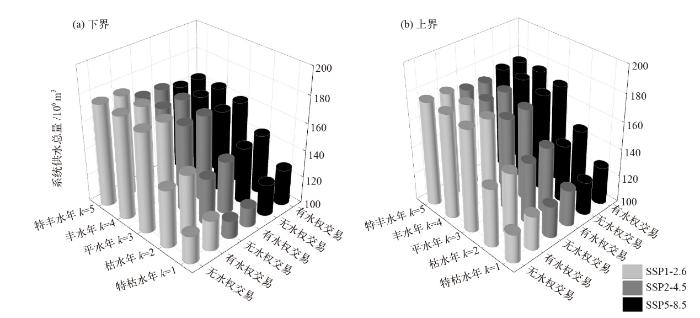
图7
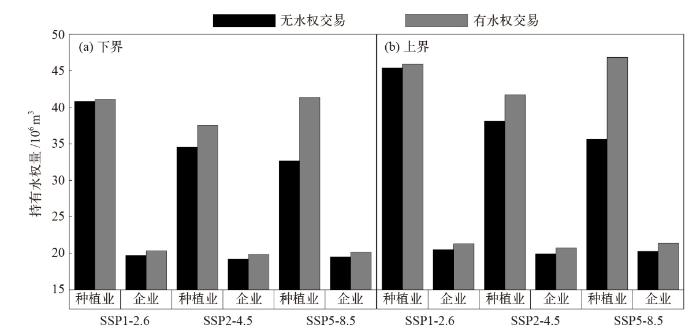
图8显示了有、无水权交易机制下的系统总效益,其中,多气候变化情景下交易机制比非交易机制系统总效益平均增加10.26% ~ 11.05%,即3.84×10⁹~4.78×10⁹元。这是因为交易机制使得系统缺水量减少,供水总量增加,系统效益随之增加。Bekchanov等[31]在中亚阿姆河和锡尔河流域构建了流域尺度的水文经济模型,发现流域间及流域内水资源交易可以明显增加流域整体收益。Xu等[32]通过对有无水交易情况下的经济效益进行比较分析,结果亦表明,各子区域的经济效益都得到了提高。多气候变化情景下交易机制带来的效益增量排序为SSP5-8.5>SSP2-4.5>SSP1-2.6,分别相应增加10.89%~12.02%、10.32%~11.82%、9.57%~10.11%,该结果与SSP5-8.5情景缺水量显著减少有关。水权交易机制下SSP1-2.6情景的系统效益最高,比SSP5-8.5情景高0.33% ~0.38%。在SSP1-2.6情景下大沽河流域的日均降雨量比SSP2-4.5、SSP5-8.5情景多,有着较高的天然径流量,从而系统供水总量最多,在系统效益上表现最优。
图8
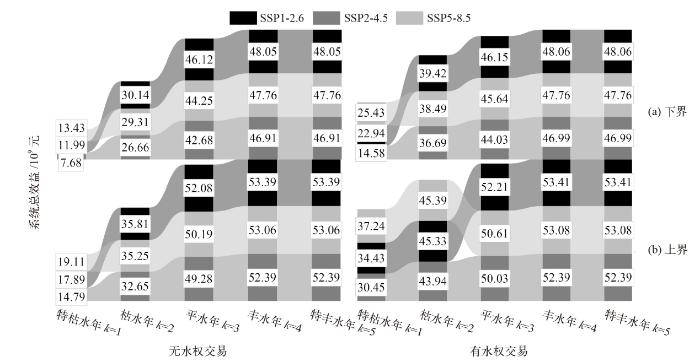
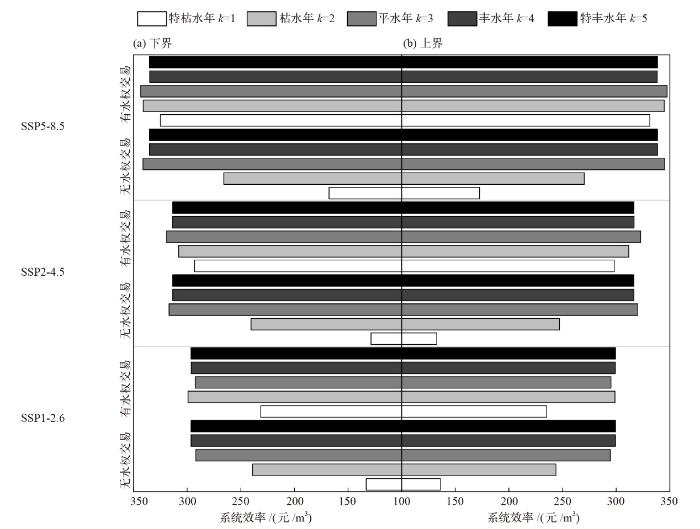
图9显示了有、无水权交易机制下的系统效率。结果表明,相比于非交易机制,交易机制下系统效率提高,具体地,多气候变化情景下系统效率平均提高9.48%~10.06%,即22.47~27.85元/m3。这是由于水权交易能够促使水资源流向高经济回报的用户,促进区域内水资源高效配置。另外,各气候变化情景下系统总效率提升排序为SSP5-8.5>SSP2-4.5>SSP1-2.6,相应地分别增加10.31% ~11.03%、9.27%~10.87%、8.85%~9.28%。这是因为SSP5-8.5情景水权交易机制下缺水量显著减少,流向高经济回报用户的水量最多,系统效率提高也最多。
图9
4 结论
本文开发了一种多气候变化情景下的随机多目标水权交易决策模型(SMWR-CC),揭示了CMIP6多社会经济路径下跨行业水权交易的水资源适应性管理效应,结论如下:
(1)降雨是天然径流量的直接来源;植物需水量与日较差、风速、饱和水汽压差呈正相关。SSP1-2.6情景下年均天然径流量、单位生产规模种植业需水量与单位面积湿地需水量最多,SSP5-8.5情景下最少。
(2)相比于非交易机制,水权交易机制能有效缓解流域缺水问题。在流域整体视角,水权交易在SSP5-8.5情景下使得缺水量显著减少,减少7.05%~14.59%,SSP1-2.6情景下缺水量略有减少,为6.37%~7.71%;从行业上看,水权交易使得企业缺水量显著减少,种植业、渔业及畜牧业次之;从空间分布上讲,大沽河流域青岛市辖区内4个县(莱西、平度、即墨、胶州)缺水量均有所减少,莱西缺水量显著减少,平均减少6.90% ~10.91%,河区上,71%的河区缺水量减少,29%的河区缺水量增多。气候变化下,水权交易驱动水权转向高效益用户,提高水资源的利用效率;又促使富水地区转让多余的水,减少系统缺水量,优化水资源的空间分布。
(3)水权交易市场下,系统供水总量增加,系统效益、效率随之增加。多气候变化情景下,交易机制比非交易机制系统供水总量、系统总效益、系统效率分别平均增加0.72%~0.90%、10.26% ~11.05%、9.48%~10.06%。交易机制在SSP5-8.5情景下使得供水总量增加最多,增加0.90%~1.08%,系统效益、系统效率提升最多,分别提升10.89%~12.02%、10.31%~11.03%。尽管交易机制在SSP5-8.5情景下对流域系统提升最多,但是SSP1-2.6情景下的供水总量、系统效益均优于其他情景,有利于保障供水安全与经济发展。
研究中仍存在尚未充分考虑的因素和局限性。例如,本研究中对未来社会、经济数据的预估是基于历史数据开展趋势外推得到的,然而,随着气候变化加剧,系统可能突破原有阈值而进入非稳态阶段,未来的研究需要进一步构建气候-社会-经济耦合模型,以反映气候变化对社会、经济系统的深刻影响;另外,本研究使用单一气候模式,无法反映模式间的模拟偏差,未来我们将采用CMIP6多模式集合预报量化不确定性,获得稳健、科学数据基础。本文仅为当前阶段的探索性分析,我们诚挚地欢迎国内外同行就此项研究提出宝贵意见,从而进一步完善气候变化研究体系。
参考文献
Water resources management under climate change: a review
[J].
DOI:10.3390/su16093590
URL
[本文引用: 1]

Climate change affects water resources through the decrease in rainfall and the increase in temperatures and evapotranspiration. An indirect impact of climate change is also the increase in water uses by human activities. In this review, 320 papers were retrieved, of which 134, spanning five continents and dealing with impacts and solutions, were selected to be used to better understand the effects of climate change on water resources, ecosystems, human health, security, and socio-economic aspects. Here, suggestions and proposals towards solutions by scientists from around the world, tips and ideas to deal with climate change, and the best solutions for future water management are presented. The main solutions highlighted concern integrated water resource management, political direction, policies, an increase in knowledge, and new technologies. Furthermore, most of the analyzed papers underline that water resource management needs to incorporate the protection and restoration of ecosystems and their services. Nature-based solutions need to be the starting point of new scientific and innovative ways to deal with climate change and look towards future climate adaptation. In this complex evolution of the water resource, the political position of Italy is also shown, illustrating what actions could be implemented for water resource management.
Impact of climate change on water resources in the Shiyang River basin and the adaptive measures for energy conservation and emission reduction
[J].
Climate change and the water footprint of wheat production in Zimbabwe
[J].
Modelling regional variability of irrigation requirements due to climate change in Northern Germany
[J].DOI:10.1016/j.scitotenv.2015.09.043 URL [本文引用: 1]
Tidal wetlands in a changing climate: introduction to a special feature
[J].
DOI:10.1007/s13157-019-01245-9
[本文引用: 1]
Through multiple interacting forcing factors, global climate change is poised to alter the structure and function of tidal wetlands worldwide, and consequently, the ecosystem services they provide. For low-lying tidal wetlands, these impacts arise largely as a result of changes in macroclimatic conditions; inputs of freshwater, nutrients, and sediments from coastal watersheds; sea-level rise; and storm activity. Collectively, these climate-driven impacts influence the hydrology, physicochemical environment, species composition, and ecological functioning of tidal wetlands. Given the scope of the threat, it is important to examine climate-change impacts at various spatial and temporal scales and across the various sub-disciplines of wetland science. Insight into climate impacts can inform vulnerability assessments, conservation and restoration plans, and adaptation and mitigation strategies. The articles in this special feature cover a range to topics related to climate-change impacts on tidal wetlands from different biogeographic regions around the world. They examine shifts in foundation species, impacts to wildlife habitat, the use of models to predict responses to different climate-change scenarios, and the potential for restoration to sustain tidal wetlands in the face of climate change.
Adaptation of water resources system to water scarcity and climate change in the suburb area of megacities
[J].DOI:10.1007/s11269-020-02648-8 [本文引用: 1]
Impact of climate change on transboundary water sharing
[J].DOI:10.1061/(ASCE)0733-9496(2007)133:5(405) URL [本文引用: 1]
Multi-object approach and its application to adaptive water management under climate change
[J].
DOI:10.1007/s11442-017-1375-7
[本文引用: 1]
This paper addresses issues on adaptive water management under the impact of climate change. Based on a set of comprehensive indicators of water system, a decision making approach of multi-objects is developed and applied to quantify water adaptive management for the demands of water sustainable use, water environmental protection and eco-water requirement under the climate change. For this study in China, two key indicators are proposed, namely (1) the water resources vulnerability (V) that was represented by integrated sensitivity (S) and resilience (C) of climate change impact on water resources, and (2) the sustainability of socio-economy and water environment, marked by DD, that is integrated scaler of socio-economic development (EG) based on the amount of GDP and the water environment and relative eco-system quality (LI). To find a reasonable solution for adaptive water management, a multi-objective decision making model of adaptive water management is further developed and the multi-objective model was transformed into an integrated single optimization model through developing an integrated measure function, called as VDD=DD/V. This approach has been applied to adaptive water resources planning and management for case study of China with new policy, called as the strict management of water resources based on three red line controls, i.e., the control of total water use by the total water resources allocation, the control of lower water use efficiency by the water demand management and the control of the total waste water load by water quality management in the Eastern China Monsoon Region that covers major eight big river basins including Yangtze River, Yellow River, Haihe River and Huaihe River. It is shown that the synthetic representation of water resource vulnerability and socio-economic sustainability by the integrated objective function (VDD) and integrated decision making model are workable and practicable. Adaptive management effect of the criterion compliance rate and water use efficiency are more appreciable through new water policy of the three red line controls, which can reduce 21.3% of the water resources vulnerability (V) and increase 18.4% of the sustainability of socio- economy and water environment (DD) for the unfavorable scenario of climate change in 2030.
Climate change contributions to water conservation capacity in the upper Mekong River basin
[J].
DOI:10.3390/w16182601
URL
[本文引用: 1]
Investigations into the impacts of climate change on water conservation capacity in the upper Mekong River Basin (UMRB) are important for the region’s sustainability. However, quantitative studies on isolating the individual contribution of climate change to water conservation capacity are lacking. In this study, various data-driven SWAT models were developed to quantitatively analyze the unique impact of climate change on water conservation capacity in the UMRB. The results reveal the following: (1) From 1981 to 2020, the annual water conservation capacity ranged from 191.6 to 392.9 mm, showing significant seasonal differences with the values in the rainy season (218.6–420.3 mm) significantly higher than that in the dry season (−57.0–53.2 mm). (2) The contribution of climate change to water conservation capacity is generally negative, with the highest contribution (−65.2%) in the dry season, followed by the annual (−8.7%) and the rainy season (−8.1%). (3) Precipitation, followed by evaporation and surface runoff, emerged as the critical factor affecting water conservation capacity changes in the UMRB. This study can provide insights for water resources management and climate change adaptations in the UMRB and other similar regions in the world.
Impacts of surface and groundwater variability response to future climate change scenarios in a large Mediterranean watershed
[J].DOI:10.1007/s12665-017-6721-7 URL [本文引用: 1]
Identifying water resources management strategies in adaptation to climate change under uncertainty
[J].DOI:10.1007/s11027-017-9749-9 URL [本文引用: 1]
A method for setting the term of water rights trading based on loss-benefit function
[J].
DOI:10.2166/ws.2023.278
URL
[本文引用: 1]
At present, water rights trading is used by many countries around the world to solve the problems of water resource shortage and uneven spatial and temporal distribution. However, there is no scientific method for setting the term of water rights trading, which is generally determined through negotiation between the trading parties. In order to find a more objective method for determining the term of water rights trading, we constructed a loss–benefit model about the term of water rights trading and solved it based on the principle of comprehensive benefits greater than zero to determine the optimal term of water rights trading. First, we analyzed the benefits and losses brought by water rights trading, then constructed a loss–benefit function with trading term as the independent variable. Second, based on the graphical analysis method, we analyzed the benefits and losses of water rights trading. Finally, the optimal term for water rights trading is determined based on the loss–benefit function and combined with a graphical analysis method. In addition, this study can also help us determine the longest or shortest water rights trading term based on actual situations.
Economic effects of climate change in the Murray-Darling basin, Australia
[J].DOI:10.1016/j.agsy.2012.03.009 URL [本文引用: 1]
Modeling climate change impacts on water trading
[J].DOI:10.1016/j.scitotenv.2010.02.014 URL [本文引用: 1]
An improved fuzzy analytic hierarchy process for the allocation of water rights to industries in Northeast China
[J].
DOI:10.3390/w12061719
URL
[本文引用: 1]
To facilitate water management and efficient utilization of water resources, the allocation of water rights to individual industries must be underpinned by a rational and defensible process. This study aimed to develop an improved fuzzy analytic hierarchy process method of allocating water rights to different industries and focused on Qing’an County, northeast China as a case study. An evaluation index system for allocation of initial water rights was established, and incorporated physiographic, societal, economic, and ecological criteria. The system classifies four categories of second-level indices, 14 third-level indices, and 30 fourth-level indices. The order of priority of the evaluation index was determined and the total weight of initial water rights for different industries was calculated using the fuzzy analytic hierarchy process method. Results showed that the indices for the allocation of initial water rights ranked in descending order of their total weights coefficient were: (1) agricultural water rights: 0.9508; (2) residential water rights: 0.0240; (3) water rights for non-agricultural production: 0.0173; (4) environmental water rights: 0.0078. Agricultural water consumption accounted for the largest proportion of total water because the study area is a major grain production area. The study provides a theoretical basis for the allocation of water rights and water rights trading in northeast China.
青岛市大沽河流域近20年水文情势变化分析
[J].
Analysis of hydrological changes in last 20 years in Dagu River basin of Qingdao
[J].
River damming and drought affect water cycle dynamics in an ephemeral river based on stable isotopes: the Dagu River of North China
[J].DOI:10.1016/j.scitotenv.2020.143682 URL [本文引用: 1]
Estimating the eco-environmental value of damages caused by groundwater over drafting
[J].DOI:10.1007/s13762-018-1808-6 [本文引用: 1]
多气候模式的全国月降水预测能力评价及偏差校正
[J].
DOI:10.12396/znsd.221600
[本文引用: 1]
月降水预测对水资源配置和规划管理等具有重要意义,但其受到多种因素的影响,预测难度和不确定性均较大。为探究基于气候模式的月降水预测在中国区域的表现和偏差校正方法对预测能力的影响,以中国大陆为研究区域,选取1981-2014年为研究时段,评价了九种气候模式(CFSv2, SEAS5, CanSips, GEMNEMO, CCSM4, GFDL, CanCM3, CanCM4, GEOSS2S)在不同预见期下对月降水的预测能力,采用聚类分析方法分析了气候模式的预测能力随预见期的变化规律,并采用线性偏差校正方法(Linear Scaling,LS)和分位数映射校正方法(Quantile Mapping,QM)对降水进行后处理,比较了两种偏差校正方法在验证期(2008-2014年)的校正效果。结果表明:①不同气候模式之间对降水的预测精度差异较大,对夏季降水的预测能力因预见期和预测区域而异,其中SEAS5模式在不同经纬度和不同预见期下的综合表现均最优,且其预测能力随预见期的延长变化稳定;②偏差校正对所有气候模式的降水预测均有明显的改进效果,两种偏差校正方法的效果相近,但经过LS方法校正后降水的平均绝对相对误差小于50%,总体上略优于QM方法,此外经过偏差校正后SEAS5模式的综合表现依然最优。研究结果揭示了SEAS5模式对中国大陆月降水预测的优势和偏差校正方法对气候模式预测能力的提升作用,可为基于气候模式的降水预测应用提供参考。
Evaluation of monthly precipitation prediction based on climate model and bias correction in China
[J].
Application of relative importance metrics for CMIP6 models selection in projecting basin-scale rainfall over Johor River basin, Malaysia
[J].
Evaluation of crop water requirements for Yazagyo irrigated area, Myanmar
[J].
DOI:10.1088/1757-899X/849/1/012090
[本文引用: 1]
Accurate estimation of crop water requirements (ETc) is essential for the irrigation scheduling and water management of Yazagyo irrigated area, Myanmar. FAO defined the crop water requirements as the depth of water needed to meet the water loss through evapotranspiration of a crop, being disease-free, growing in large fields under non-restricting soil conditions, including soil water and fertility, and achieving full production potential under the given growing environment. It is essential to have a clear idea about the optimum water requirement for proposed crops under adaptable climatic conditions. The optimal crop water requirement mainly depends upon the accurate estimation of evapotranspiration and crop coefficient. To perform in this study, firstly Meteorological data of Kalay Station, in Myanmar are collected from 1995 to 2018. On the other hand, the different kinds of crops such as paddy, groundnut, sesame, sunflower, bean, and pea are considered for the estimation of seasonal crop water requirements for this area. Based on the crop growth stages in this area, crop coefficient curves are developed and crop coefficients are determined for each crop according to FAO manual. By using monthly crop coefficients and CROPWAT 8.0 software, reference crop evapotranspiration, crop water requirements and total irrigation requirements are presented for the selected area.
莫莫格自然保护区湿地生态需水量计算
[J].
Application of wetted perimeter method in determining critical point of river eco-environment water demand
[J].
永年洼湿地生态需水量初步研究
[J].
Preliminary study on the ecological water requirement of Yongnianwa wetland
[J].
湿地生态环境需水量等级划分与实例分析
[J].该文基本生态学的方法,按照湿地生态系统的组成结构及其功能,确定了湿地生态环境需水量的5个等级,即最大、最优、优等、中等和最小需水量。在此基础上,对湿地生态环境需水量各类级别的划分方法进行了分析,特别是对湿地植物需水量、湿地土壤需水量、净化污染物需水量等级进行了重点探讨,提出了相关的指标标准和相应级别。同时在相应计算公式的基础上,列出了各类型级别的需水量。以黄淮海地区作为案例,计算了该区湿地生态环境需水量,强调了保证和维持最小生态环境需水量的重要性。同时以相关规划为依据,对该区未来湿地生态环境需水量进行了预测。结果展示,包括典型湿地和湿地自然保护区在内,最小生态环境需水量平均为146.8×10⁸m3,最优需水量平均为310×108m3.预测2010年、2030年和2050年湿地生态环境需水量分别为115.4×10⁸m3-153.6×10⁸m3,155.8×108m3-205.6×10⁸m3和206.8×10⁸m3-269.7×10⁸m3。
The classification and case study oneco-environmental water requirement of wetlands
[J].
Unveiling impacts and optimal strategies of water-saving system for integrated water resources management in a water-scarce watershed
[J].DOI:10.1016/j.jenvman.2024.123435 URL [本文引用: 1]
A nexus approach engaging water rights transfer for addressing water scarcity in energy and food production under uncertainty
[J].DOI:10.1016/j.jenvman.2022.115163 URL [本文引用: 1]
不确定性条件下斯里兰卡马哈韦利河流域农业水权交易研究
[J].
Research on agricultural water rights trading in the Mahaweli River basin of Sri Lanka under uncertainty
[J].
Potential gains from water rights trading in the Aral Sea basin
[J].DOI:10.1016/j.agwat.2014.12.011 URL [本文引用: 1]
Optimal irrigation for sustainable development considering water rights transaction: a Stackelberg-nash-cournot equilibrium model
[J].DOI:10.1016/j.jhydrol.2019.05.063 URL [本文引用: 1]
