气候变化研究进展 ›› 2025, Vol. 21 ›› Issue (6): 789-806.doi: 10.12006/j.issn.1673-1719.2025.105
全球产业链下可再生能源部门隐含碳驱动因素研究
郭晨雨1, 陈聪1( ), 赵书园1, 董聪2
- 1 北京科技大学经济管理学院,北京 100083
2 广东工业大学管理学院,广州 510520
-
收稿日期:2025-05-14修回日期:2025-07-14出版日期:2025-11-30发布日期:2025-11-11 -
通讯作者:陈聪,女,副教授,chencong@ustb.edu.cn -
作者简介:郭晨雨,女,硕士研究生 -
基金资助:国家自然科学基金杰青项目(52125902)
Analyzing drivers of embodied carbon in renewable energy sector within global industry chains
GUO Chen-Yu1, CHEN Cong1(), ZHAO Shu-Yuan1, DONG Cong2
- 1 School of Economics and Management, University of Science and Technology Beijing, Beijing 100083, China
2 School of Management, Guangdong University of Technology, Guangzhou 510520, China
-
Received:2025-05-14Revised:2025-07-14Online:2025-11-30Published:2025-11-11
摘要:
气候变化推动全球能源体系向可再生能源过渡,但伴随其产业链上下游排放增长的新挑战。文中从全球价值链视角出发,重点考虑贸易关联因素,基于多区域投入产出模型和结构分解分析技术,系统探究了可再生能源发电部门的隐含碳驱动因素,并分析了不确定性信息对核算结果的影响。研究发现:(1)从2016到2022年,全球可再生能源发电部门CO2净转移量减少2.49%。(2)总体需求增长是隐含碳排放上升的主导因素,生产结构优化效应在降碳方面发挥显著作用。(3)风能和太阳能热能发电部门的碳排放强度效应呈现先减后增趋势,反映了技术进步与规模扩张的复杂关联。(4)中国、美国、德国及墨西哥等国在进口商品过程中隐含可再生能源电力显著增加,其中德国作为出口国,其出口产品导致可再生能源部门隐含碳排放增排0.27 Mt,凸显了国际贸易在能源转型及降碳中的重要作用。本研究为理解可再生能源在全球能源转型中的复杂角色提供了新视角,并为制定精准减排策略提供了科学依据。
引用本文
郭晨雨, 陈聪, 赵书园, 董聪. 全球产业链下可再生能源部门隐含碳驱动因素研究[J]. 气候变化研究进展, 2025, 21(6): 789-806.
GUO Chen-Yu, CHEN Cong, ZHAO Shu-Yuan, DONG Cong. Analyzing drivers of embodied carbon in renewable energy sector within global industry chains[J]. Climate Change Research, 2025, 21(6): 789-806.
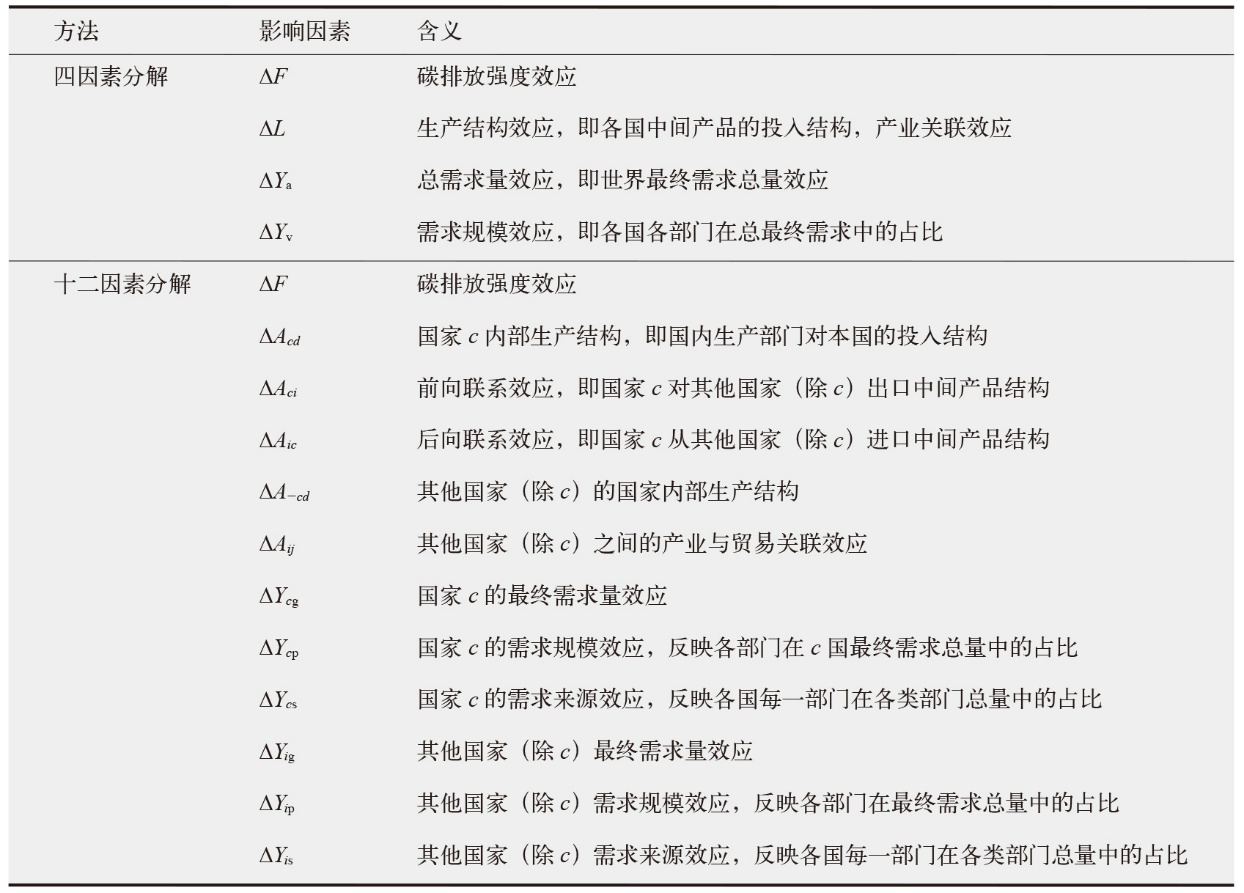 |
表1 碳排放影响因素解析
Table 1 Analysis of factors influencing carbon emissions
| |
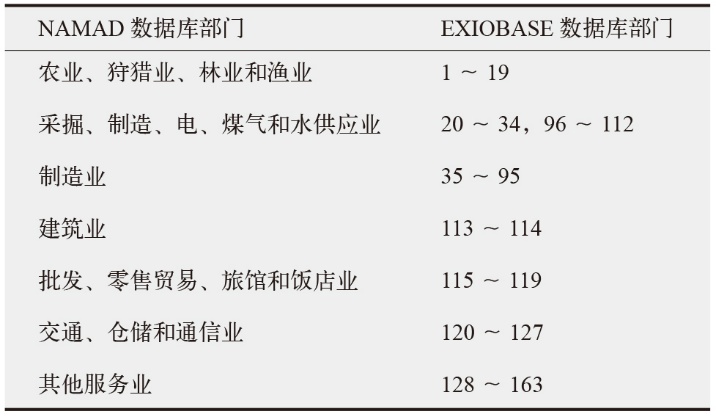 |
表2 NAMAD和EXIOBASE数据库部门匹配
Table 2 NAMAD and EXIOBASE database sector matching
| |
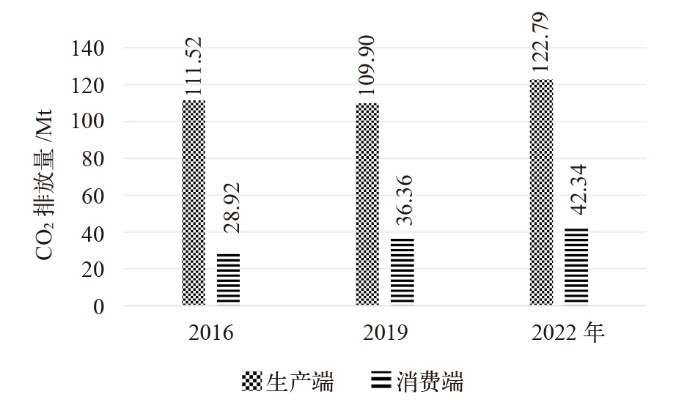
图1 2016、2019和2022年全球可再生能源发电部门在生产端和消费端的碳排放情况
Fig. 1 Global carbon emissions from the renewable energy generation sector on the production and consumption sides in 2016, 2019 and 2022
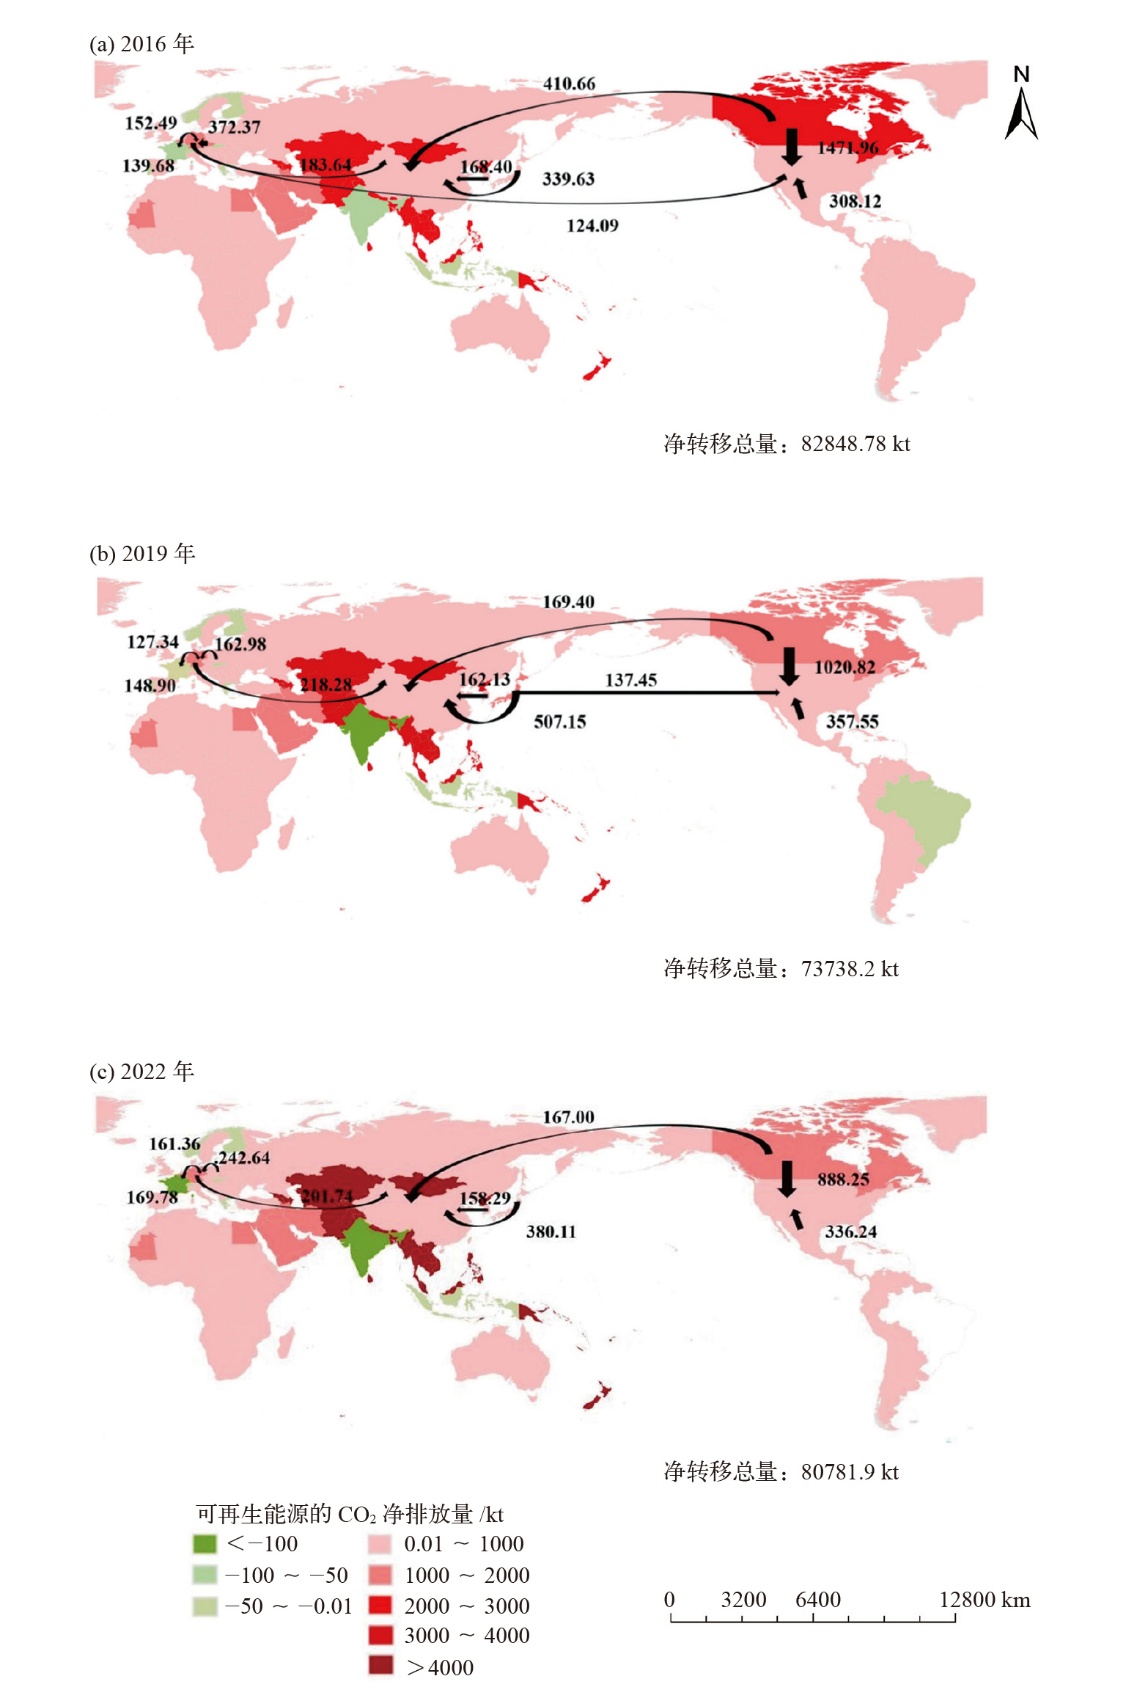
图2 全球可再生能源发电部门隐含CO2 2016、2019、2022年转移特征 注:基于自然资源部标准地图服务网站下载的审图号为 GS(2016)1665 号的标准地图制作,底图无修改。黑色箭头方向表示路径流向,显示某一地区向另一地区出口的可再生能源产品隐含碳排放量。地图底色分别表示该地区可再生能源相关碳排放的净出口:红色表示净排放为正,绿色表示净排放为负,颜色深浅反映绝对值大小;0和缺失值为空白。
Fig. 2 Characteristics of embodied carbon dioxide transfer in global renewable energy generation sectors in 2016, 2019, and 2022
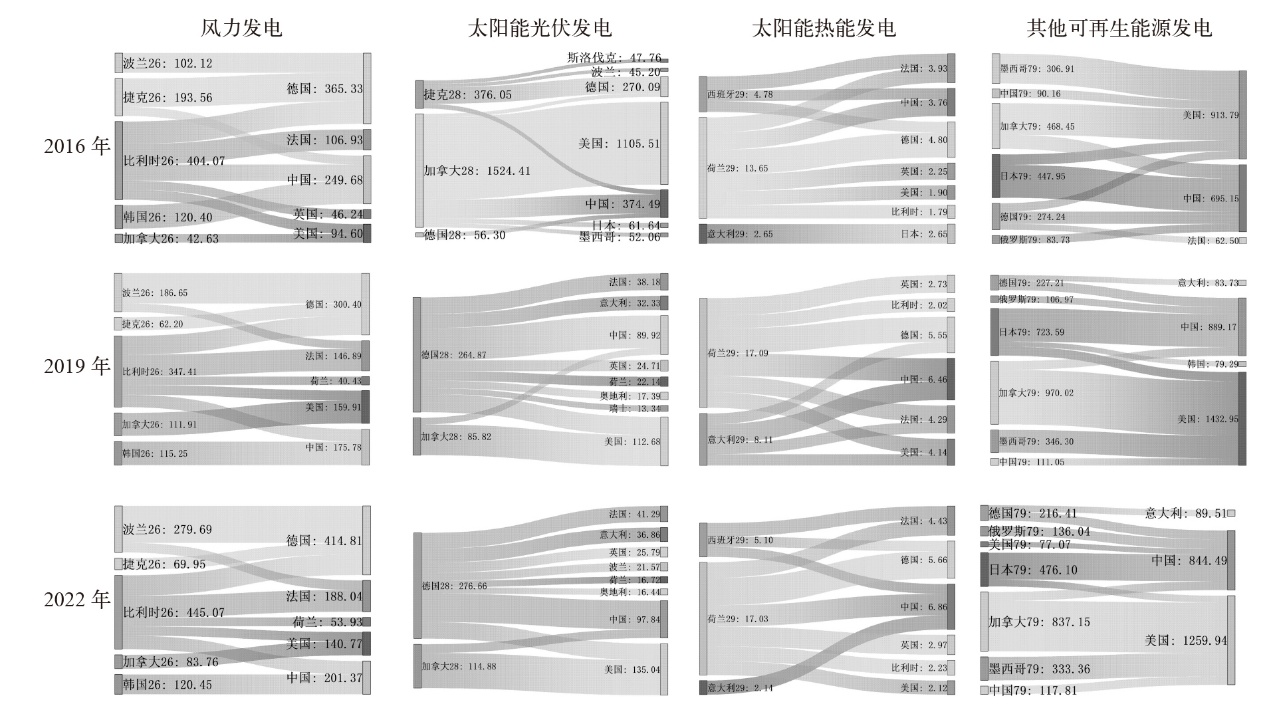
图3 4类可再生能源发电部门前十大转移路径 注:图中26、28、29、79分别代表风力发电、太阳能光伏发电、太阳能热能发电、其他可再生能源发电;图中左侧数据为各地区可再生能源发电部门CO2流出量,右侧数据为各地区CO2流入量,单位都为kt。
Fig. 3 Top ten transfer paths for four types of renewable energy power generation sectors
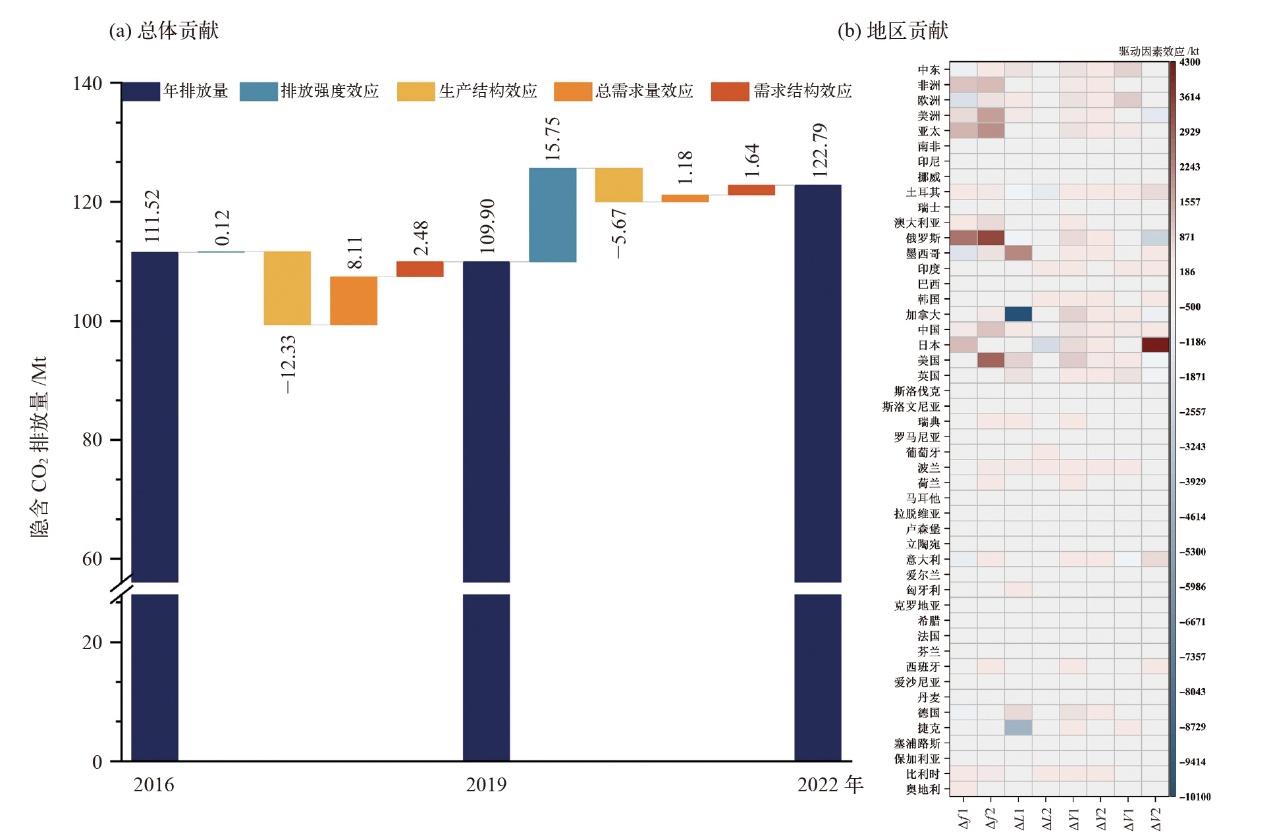
图4 可再生能源发电部门四因素驱动因素分析(a)总体贡献,(b)地区贡献 注:(b)图横坐标Δf为碳排放强度效应,ΔL为生产结构效应,ΔY为总需求量效应,ΔV为需求规模效应;数字1代表2016—2019年,数字2代表2019—2022年。例如,Δf1指2016—2019年的碳排放强度效应,Δf2指2019—2022年的碳排放强度效应。
Fig. 4 Analysis of four driving factors in the renewable energy power generation sector. (a) Overall contribution, (b) region contribution
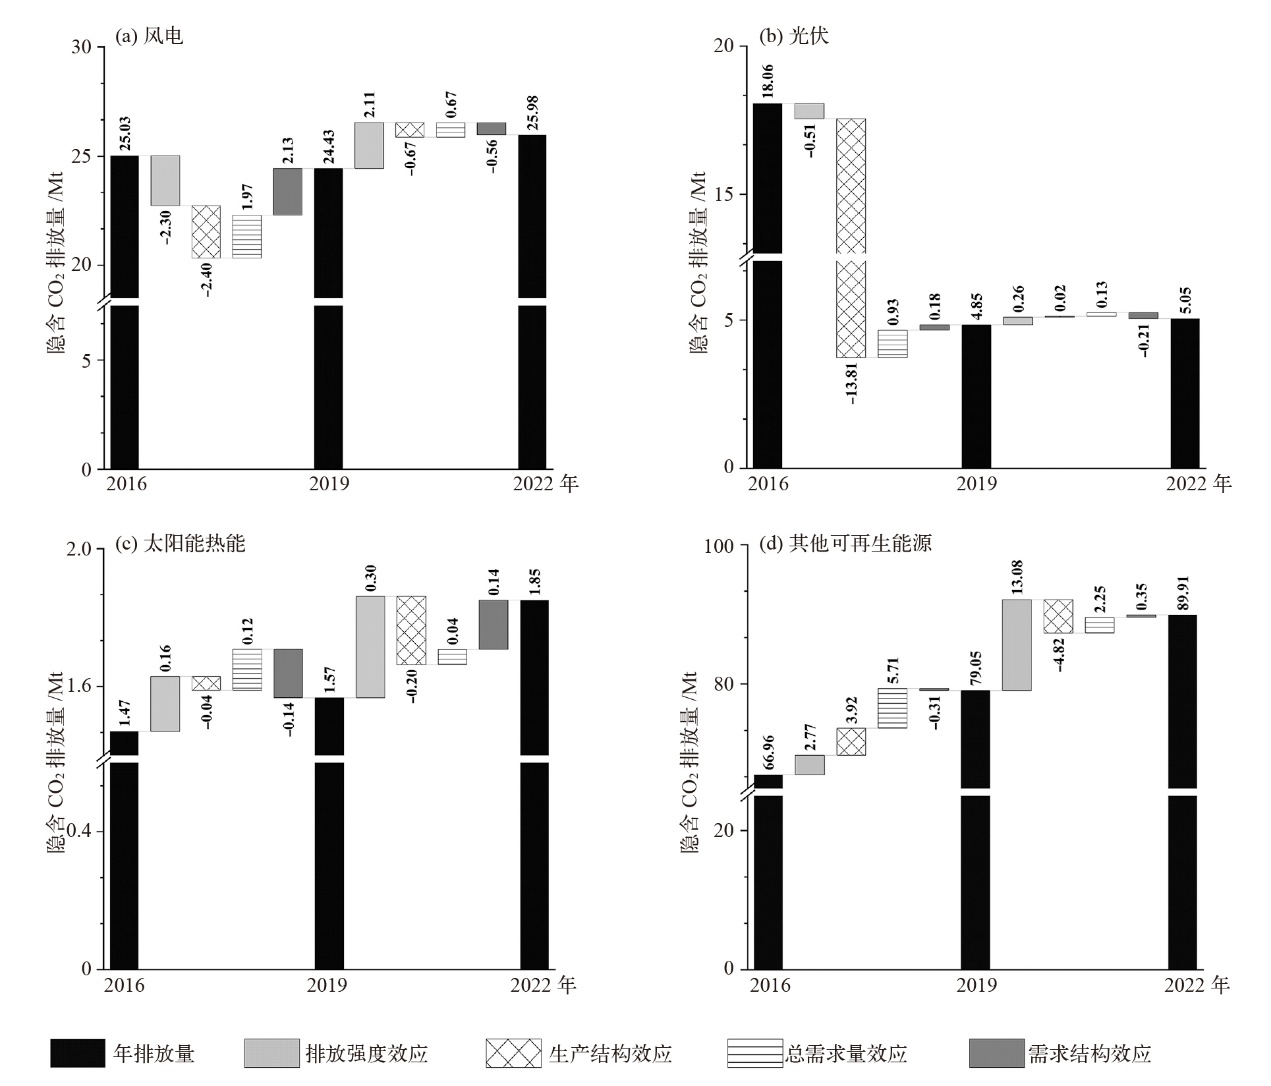
图5 不同发电部门四因素分析(a)风电,(b)光伏,(c)太阳能热能,(d)其他可再生能源
Fig. 5 Analysis of four driving factors in different power generation sectors. (a) Wind power, (b) solar photovoltaic, (c) solar thermal, (d) other renewable energy
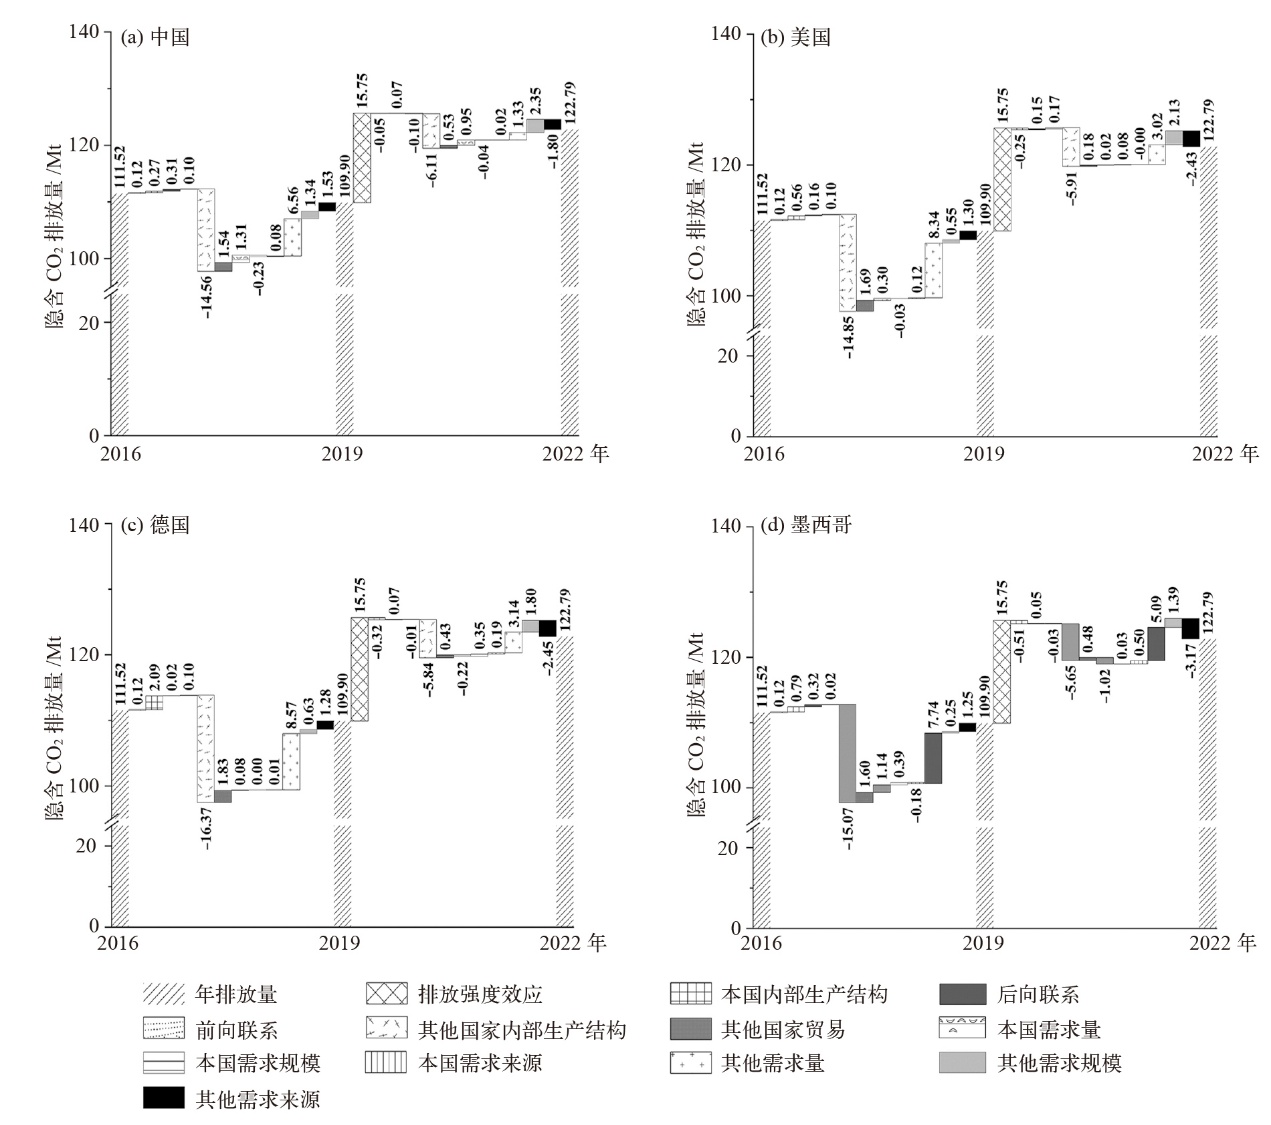
图6 可在生能源发电部门十二因素分析(a)中国,(b)美国,(c)德国,(d)墨西哥
Fig. 6 Analysis of twelve factors in the renewable energy power generation sector. (a) China, (b) the United States, (c) Germany, (d) Mexico
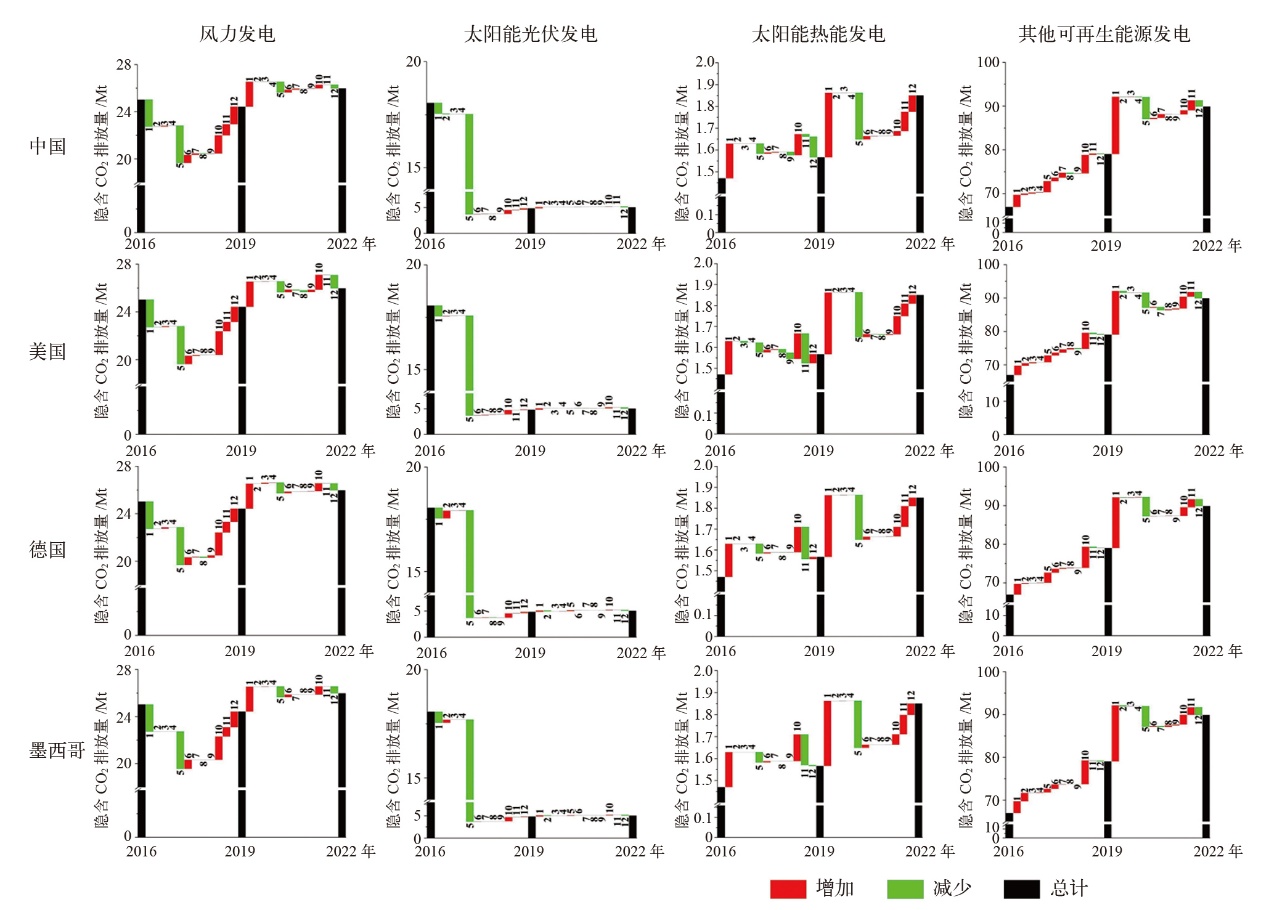
图7 4类可再生能源发电部门驱动因素分析 1 :排放强度效应 2:本国内部生产结构 3:后向联系 4:前向联系 5:其他国家内部生产结构 6:其他国家贸易 7:本国需求量8:本国需求规模 9:本国需求来源 10:其他需求量 11:其他需求规模 12:其他需求来源
Fig. 7 Analysis of driving factors for four types of renewable energy power generation sectors
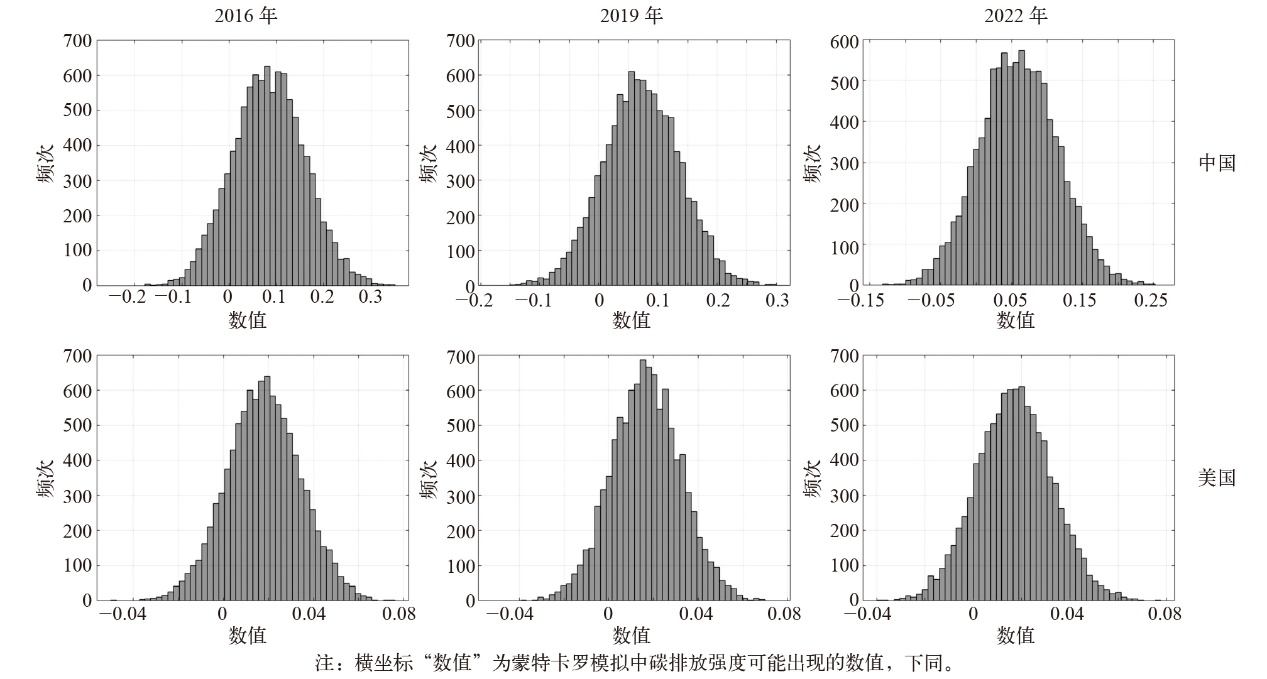
图8 碳排放强度的蒙特卡罗模拟结果(基础情景) 注:横坐标“数值”为蒙特卡罗模拟中碳排放强度可能出现的数值,下同。
Fig. 8 Monte Carlo simulation results of carbon emission intensity (baseline)
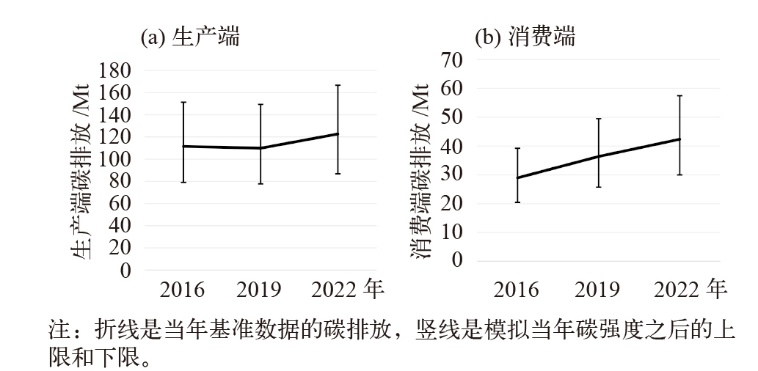
图9 基于碳排放强度模拟的隐含碳排放结果 注:折线是当年基准数据的碳排放,竖线是模拟当年碳强度之后的上限和下限。
Fig. 9 Carbon emission results based on carbon emission intensity simulation
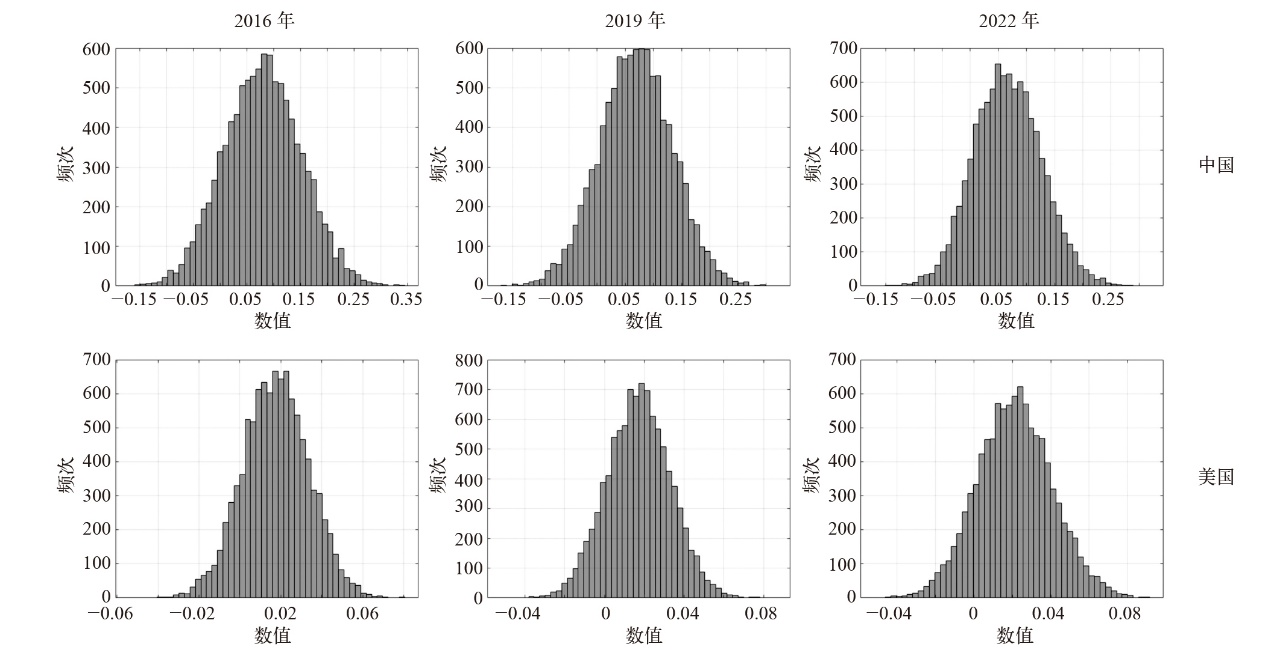
图10 碳排放强度的蒙特卡罗模拟结果(SDA)
Fig. 10 Monte Carlo simulation results of carbon emission intensity (SDA)
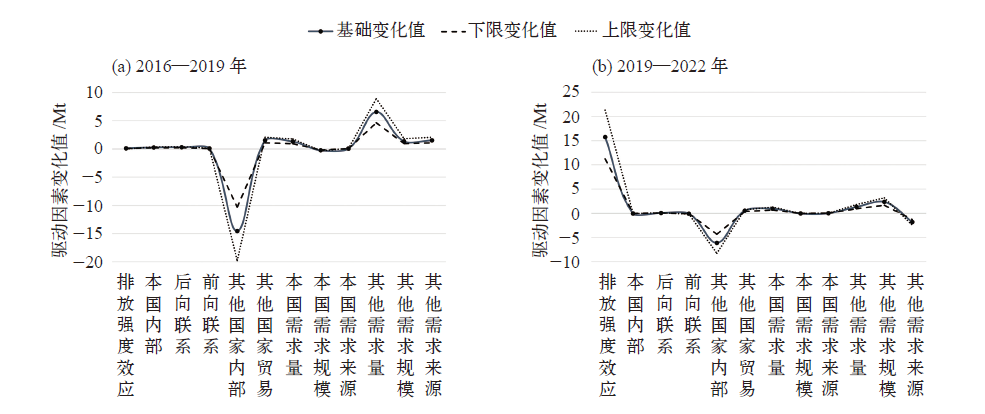
图11 蒙特卡罗模拟后各驱动因素的变化情况
Fig. 11 Changes in drivers after Monte Carlo simulation
| [1] | UNFCCC. 2024 NDC synthesis report[R/OL]. 2024 [2025-05-14]. https://unfccc.int/process-and-meetings/the-paris-agreement/nationally-determined-contributions-ndcs/2024-ndc-synthesis-report |
| [2] | British Petroleum (BP). BP energy outlook[R/OL]. 2023 [2025-05-14]. https://www.bp.com/content/dam/bp/business-sites/en/global/corporate/pdfs/energy-economics/energy-outlook/bp-energy-outlook-2023.pdf |
| [3] |
Fu R, Peng K, Wang P, et al. Tracing metal footprints via global renewable power value chains[J]. Nature Communications, 2023, 14 (1): 3703
doi: 10.1038/s41467-023-39356-x pmid: 37349289 |
| [4] |
Wang Z, Peng H, Meng J, et al. Enormous inter-country inequality of embodied carbon emissions and its driving forces in South America[J]. Global Environmental Change, 2024, 89: 102944
doi: 10.1016/j.gloenvcha.2024.102944 URL |
| [5] |
邢贞成, 王济干, 冯奎双, 等. 国际贸易中碳排放与增加值的虚拟转移及其不公平性研究[J]. 世界地理研究, 2023, 32 (8): 16-24, 138.
doi: 10.3969/j.issn.1004-9479.2023.08.2021735 |
|
Xing Z C, Wang J G, Feng K S, et al. Study on virtual transfer of carbon emissions and value added in international trade and its inequality[J]. World Regional Studies, 2023, 32 (8): 16-24, 138 (in Chinese)
doi: 10.3969/j.issn.1004-9479.2023.08.2021735 |
|
| [6] |
史江兰, 凌昕怡, 范梦涵, 等. 生产和消费双重视角下中国省域隐含碳转移研究[J]. 地域研究与开发, 2024, 43 (6): 165-170.
doi: 10.3969/j.issn.1003-2363.2024.06.024 |
| Shi J L, Ling X Y, Fan M H, et al. Inter-regional transfer of China’s embodied carbon from production-and consumption-based perspectives[J]. Areal Research and Development, 2024, 43 (6): 165-170 (in Chinese) | |
| [7] |
宋文明, 汤淑娟, 邹嘉龄, 等. 中国南北差距扩大背景下区域间隐含碳和增加值流动[J]. 资源科学, 2024, 46 (11): 2163-2177.
doi: 10.18402/resci.2024.11.06 |
|
Song W M, Tang S J, Zou J L, et al. Interregional flows of embodied carbon and value-added in the context of widening north-south disparities in China[J]. Resources Science, 2024, 46 (11): 2163-2177 (in Chinese)
doi: 10.18402/resci.2024.11.06 |
|
| [8] |
Mi Z, Zheng J, Meng J, et al. Carbon emissions of cities from a consumption-based perspective[J]. Applied Energy, 2019, 235: 509-518
doi: 10.1016/j.apenergy.2018.10.137 |
| [9] |
杨子涵, 彭宝玉, 孙君. 京津冀地区产业链空间网络及其隐含碳排放研究[J]. 地理科学进展, 2024, 43 (2): 215-230.
doi: 10.18306/dlkxjz.2024.02.002 |
|
Yang Z H, Peng B Y, Sun J. Spatial network of industrial chains and their embodied carbon emissions in the Beijing-Tianjin-Hebei region[J]. Progress in Geography, 2024, 43 (2): 215-230 (in Chinese)
doi: 10.18306/dlkxjz.2024.02.002 |
|
| [10] | 戴奇乐, 牛仕成, 牛亮. 中国产业部门隐含碳排放测算与关联效应研究[J]. 价格理论与实践, 2024 (7): 77-83. |
| Dai Q L, Niu S C, Niu L. Study on calculation and correlation effect of industrial embodied carbon emission created by China’s industrial sector[J]. Price: Theory & Practice, 2024 (7): 77-83 (in Chinese) | |
| [11] | 王敏, 吴映梅, 王洋, 等. 中国行业碳排放动态变化特征及网络结构演化[J]. 环境科学, 2024, 45 (10): 5591-5600. |
| Wang M, Wu Y M, Wang Y, et al. Characterization of industrial carbon emission dynamics and network structure evolution in China[J]. Environmental Science, 2024, 45 (10): 5591-5600 (in Chinese) | |
| [12] |
Lu C, Du Q, Li J T, et al. Trade embodied CO2 transfers from transportation sector: a nested multi-scale input-output perspective[J]. Transportation Research Part D, 2023, 119: 103727
doi: 10.1016/j.trd.2023.103727 URL |
| [13] |
Coester A, Hofkes W M, Papyrakis E. Cross-border electricity transfers in the case of differentiated renewable energy sources: a simulation analysis for Germany and Spain[J]. Energy Reports, 2024, 11: 3792-3814
doi: 10.1016/j.egyr.2024.02.045 URL |
| [14] | Vicent A, Emilio P, Pablo R D. The driving factors of CO2 emissions from electricity generation in Spain: a decomposition analysis[J]. Energy Sources, Part B: Economics, Planning, and Policy, 2022, 17 (1): 1-14 |
| [15] |
Wang J, Li Z M, Wu T, et al. The decoupling analysis of CO2emissions from power generation in Chinese provincial power sector[J]. Energy, 2022, 255: 124488
doi: 10.1016/j.energy.2022.124488 URL |
| [16] |
Rodrigues F J, Wang J, Behrens P, et al. Drivers of CO2 emissions from electricity generation in the European Union 2000-2015[J]. Renewable and Sustainable Energy Reviews, 2020, 133: 110104
doi: 10.1016/j.rser.2020.110104 URL |
| [17] |
Su B, Ang W B. Structural decomposition analysis applied to energy and emissions: aggregation issues[J]. Economic Systems Research, 2012, 24 (3): 299-317
doi: 10.1080/09535314.2012.677997 URL |
| [18] |
Luo F, Guo Y, Yao M, et al. Carbon emissions and driving forces of China’s power sector: input-output model based on the disaggregated power sector[J]. Journal of Cleaner Production, 2020, 268: 121925
doi: 10.1016/j.jclepro.2020.121925 URL |
| [19] |
Ma J, Du G, Xie B. CO2 emission changes of China’s power generation system: input-output subsystem analysis[J]. Energy Policy, 2019, 124: 1-12
doi: 10.1016/j.enpol.2018.09.030 URL |
| [20] | Wang S G, Zhu X J, Song D, et al. Drivers of CO2 emissions from power generation in China based on modified structural decomposition analysis[J]. Journal of Cleaner Production, 2019, 20: 1143-1155 |
| [21] |
Jiang T Y, Yu Y, Jahanger A, et al. Structural emissions reduction of China’s power and heating industry under the goal of “Double Carbon”: a perspective from input-output analysis[J]. Sustainable Production and Consumption, 2022, 31: 346-356
doi: 10.1016/j.spc.2022.03.003 URL |
| [22] |
Yousaf M R, Liao B Q. Analysis of Pakistan’s electricity generation and CO2 emissions: based on decomposition and decoupling approach[J]. Journal of Cleaner Production, 2022, 359: 132074
doi: 10.1016/j.jclepro.2022.132074 URL |
| [23] |
Yu B L, Fang D B, Xiao K, et al. Drivers of renewable energy penetration and its role in power sector’s deep decarbonization towards carbon peak[J]. Renewable and Sustainable Energy Reviews, 2023, 178: 113247
doi: 10.1016/j.rser.2023.113247 URL |
| [24] |
Zhao L, Wang K, Yi H, et al. Carbon emission drivers of China’s power sector and its transformation for global decarbonization contribution[J]. Applied Energy, 2024, 376: 124258
doi: 10.1016/j.apenergy.2024.124258 URL |
| [25] | Leontief W W, Ford D. Air pollution and the economic structure: empirical results of input-output comparisons[M]. Cambridge: Harvard University, 1972 |
| [26] |
Chen W M, Zhang Z J, Chen K Y. Inter-regional economic-environmental correlation effects of power sector in China[J]. Energy, 2023, 278: 127764
doi: 10.1016/j.energy.2023.127764 URL |
| [27] | 王火根, 汪钰婷, 肖丽香. 基于IO-SDA法的2020—2060年中国行业CO2排放预测与分析[J]. 中国环境科学, 2024, 44 (3): 1743-1755. |
| Wang H G, Wang Y T, Xiao L X. Forecast and analysis of China’s industrial CO2 emissions from 2020 to 2060 based on the IO-SDA method[J]. China Environmental Science, 2024, 44 (3): 1743-1755 (in Chinese) | |
| [28] | 闫辉, 何晓晴, 张磊. 基于结构分解分析的中国建筑业碳增长影响因素识别[J]. 工程管理学报, 2024, 38 (1): 42-47. |
| Yang H, He X Q, Zhang L. Identification of influencing factors for the carbon growth in China’s construction industry based on structural decomposition analysis[J]. Journal of Engineering Management, 2024, 38 (1): 42-47 (in Chinese) | |
| [29] | Wang J, Yang S, Dong K, et al. Assessing embodied carbon emission and its drivers in China’s ICT sector: multi-regional input-output and structural decomposition analysis[J]. Energy Policy, 2024, 186: 114008. DOI:10.1016/J.ENPOL.2024.114008 |
| [30] |
Zhou Z, Wang X K, Lu L, et al. Air pollution leakage embodied in international trade: Foreign-investment-contribution-based accounting and structural decomposition analysis[J]. Journal of Cleaner Production, 2025, 504: 145407
doi: 10.1016/j.jclepro.2025.145407 URL |
| [31] | 陆轩慧, 金轩怡, 房德琳. 省际贸易含大气污染物转移特征及驱动力分析[J]. 中国环境科学, 2025, 45 (2): 1148-1161. |
| Lu X H, Jin X Y, Fang D L. Analysis of implicit air pollutant transfer and drivers of interprovincial trade in China[J]. China Environmental Science, 2025, 45 (2): 1148-1161 (in Chinese) | |
| [32] | 兰静, 司含华. 中国能源消费及碳排放变化的驱动因素分析[J]. 价值工程, 2023, 42 (34): 163-165. |
| Lan J, Si H H. Drivers of change in energy consumption and carbon emission in China[J]. Value Engineering, 2023, 42 (34): 163-165 (in Chinese) | |
| [33] |
Yuan Q, Wang Q, Zhang M. Tracing changes in manufacturing-related carbon emissions: a structural decomposition analysis from the perspective of China[J]. Structural Change and Economic Dynamics, 2024, 71: 568-581
doi: 10.1016/j.strueco.2024.09.003 URL |
| [34] | 彭水军, 张文城, 孙传旺. 中国生产侧和消费侧碳排放量测算及影响因素研究[J]. 经济研究, 2015, 50 (1): 168-182. |
| Peng S J, Zhang W C, Sun C W. China production-based and consumption-based carbon emissions and their determinants[J]. Economic Research Journal, 2015, 50 (1): 168-182 (in Chinese) | |
| [35] | Konstantin S, Richard W, Tatyana B, et al. EXIOBASE 3 (3.8.2)[DB/OL]. 2021 [2025-03-02]. https://zenodo.org/records/5589597 |
| [36] | Meng J, Mi Z, Guan D, et al. The rise of south-south trade and its effect on global CO2 emissions[J]. Nature Communations, 2018, 9: 1871 |
| [37] | The United Nations Statistics Division. National accounts:analysis of Main Aggregates (AMA)[EB/OL]. 2024 [2025-02-10]. https://unstats.un.org/unsd/snaama/ |
| [38] |
Guo C Y, Chen C, Dong C, et al. Carbon footprints and decarbonization potential in the global renewable power sector[J]. Sustainable Production and Consumption, 2025, 58: 100-122
doi: 10.1016/j.spc.2025.06.012 URL |
| [39] |
Yang Y, Cui Q, Wang H. Assessing the socioeconomic and environmental impacts of China’s power sector changes in 2010-2020[J]. Applied Energy, 2024, 364: 123159
doi: 10.1016/j.apenergy.2024.123159 URL |
| [1] | 刘元欣, 贺铄, 江雅婧, 罗旭, 袁家海. 中国四大城市群碳排放驱动因素时空分解研究[J]. 气候变化研究进展, 2024, 20(2): 231-241. |
| [2] | 谭显春, 戴瀚程, 顾佰和, 黄 晨, 朱开伟, 马啸天, 闫洪硕, 刘心远, 朱衍磊. IPCC AR6报告历史排放趋势和驱动因素核心结论解读[J]. 气候变化研究进展, 2022, 18(5): 538-545. |
| [3] | 袁路, 潘家华. Kaya恒等式的碳排放驱动因素分解及其政策含义的局限性[J]. 气候变化研究进展, 2013, 9(3): 210-215. |
| 阅读次数 | ||||||
|
全文 |
|
|||||
|
摘要 |
|
|||||