气候变化研究进展 ›› 2025, Vol. 21 ›› Issue (4): 541-554.doi: 10.12006/j.issn.1673-1719.2025.010
2000—2020年中国省际碳平衡时空演变及影响因素分析
花瑞祥1,2( ), 景宜然3()
- 1 生态环境部对外合作与交流中心,北京 100035
2 “一带一路”绿色发展国际联盟,北京 100035
3 中国环境科学研究院,北京 100012
-
收稿日期:2025-01-10修回日期:2025-02-14出版日期:2025-07-30发布日期:2025-08-06 -
通讯作者:景宜然,女,助理研究员,yrjing@163.com -
作者简介:花瑞祥,男,高级工程师,huarx1021@hotmail.com -
基金资助:“一带一路”环保合作专项(2211016007)
Analysis of the spatio-temporal evaluation and influencing factors of inter-provincial carbon balance in China from 2000 to 2020
HUA Rui-Xiang1,2(), JING Yi-Ran3()
- 1 Foreign Environmental Cooperation Center, Ministry of Ecology and Environment, Beijing 100035, China
2 The Belt and Road Initiative (BRI) International Green Development Coalition, Beijing 100035, China
3 Chinese Research Academy of Environmental Sciences, Beijing 100012, China
-
Received:2025-01-10Revised:2025-02-14Online:2025-07-30Published:2025-08-06
摘要:
以中国30个省份为研究对象,基于中国碳核算数据库和土地利用数据,分析了2000—2020年长时间序列各省份碳排放和碳汇的时空格局演变特点,基于经济协调发展指数等评估了各省份碳平衡状况,探究多个社会经济因子的影响分析。结果显示:(1)中国碳排放总量从30.5亿t(二氧化碳当量,下同)增加到109.7亿t,其中,19个省份的碳排放量一直在增长,10个省份的碳排放量先增长后下降。碳排放空间特点总体从东高西低转变为北高南低。(2)中国碳汇总量呈增长—下降—增长趋势,总体从12.61亿t略微下降至12.60亿t,多数省份碳汇量呈小幅变化。省际碳汇总体呈西高东低特点,西南、东北较高,东南次之,西北、东部则较低。(3)中国各省碳收支总体均呈赤字状态,碳赤字量呈扩大趋势,但增幅收紧。上海、天津等11个省份碳承载强度指数高、生态经济协调指数低,辽宁、陕西等9个省份碳承载强度指数较高、生态经济协调指数较低,吉林、黑龙江等10个省份碳承载强度指数较低、生态经济协调指数较高。(4)城镇化率对生态经济协调指数的贡献率呈正向,且随时间呈上升趋势,在空间上呈西北高、东南低的特点。人口总量、地区生产总值、二产增加值和煤炭消费量对生态经济协调指数的贡献率总体均为负向。专利申请授权数的贡献率总体不大,但呈正向,且空间差异性不大。
引用本文
花瑞祥, 景宜然. 2000—2020年中国省际碳平衡时空演变及影响因素分析[J]. 气候变化研究进展, 2025, 21(4): 541-554.
HUA Rui-Xiang, JING Yi-Ran. Analysis of the spatio-temporal evaluation and influencing factors of inter-provincial carbon balance in China from 2000 to 2020[J]. Climate Change Research, 2025, 21(4): 541-554.
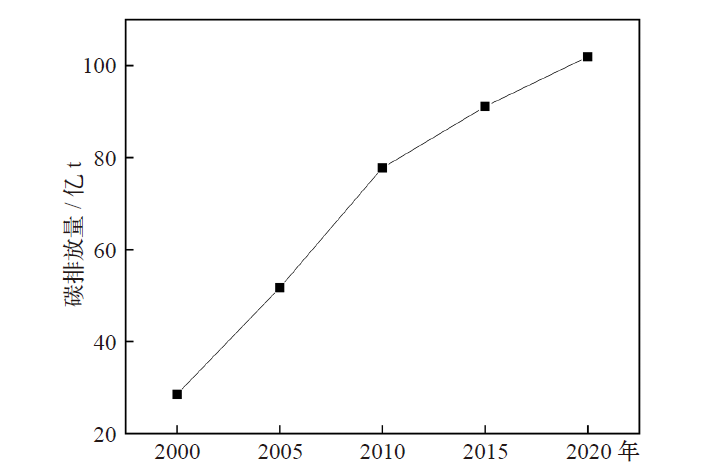
图1 2000—2020年中国碳排放总量
Fig. 1 The total carbon emissions of China from 2000 to 2020
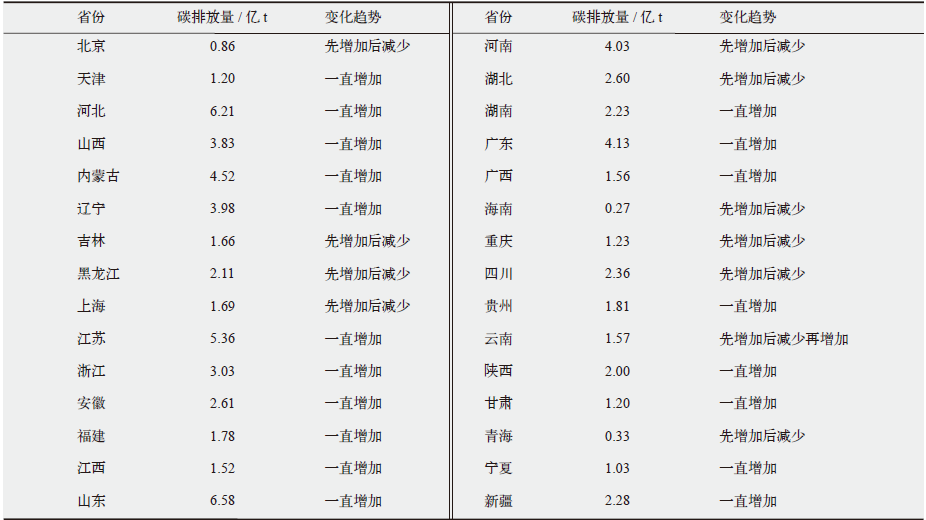 |
表1 2000—2020年中国各省碳排放量均值及变化趋势
Table 1 The mean and trend of carbon emissions across provinces from 2000 to 2020
| |
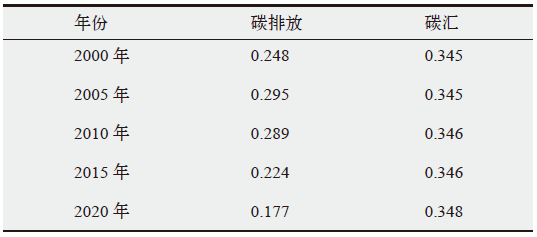 |
表2 2000—2020年中国省际碳排放和碳汇的全局空间相关性检验结果
Table 2 Global spatial autocorrelation test results of China’s inter-provincial carbon emissions and sinks from 2000 to 2020
| |
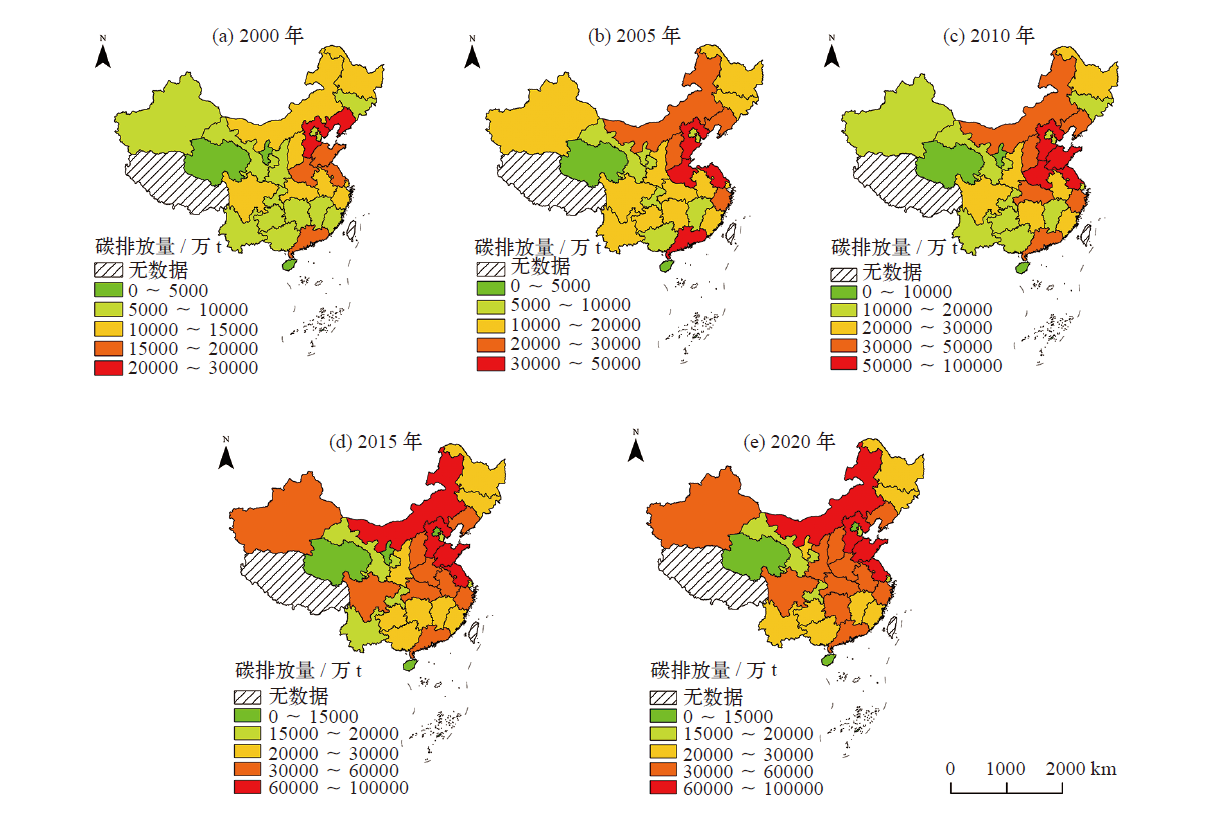
图2 2000—2020年中国各省碳排放量空间分布情况
Fig. 2 Spatial distribution of carbon emissions across provinces from 2000 to 2020
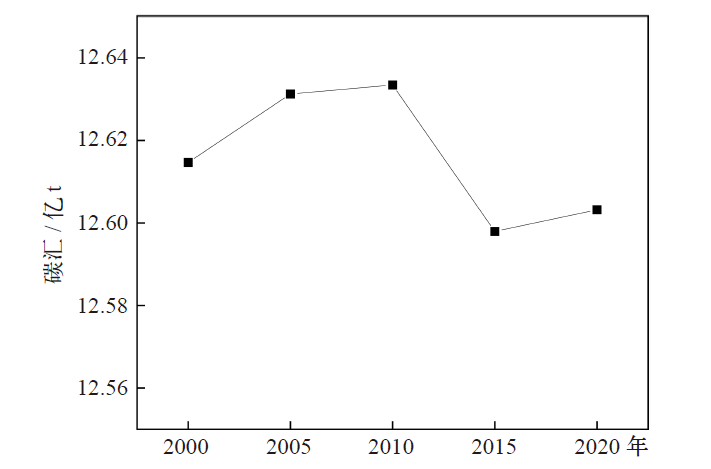
图3 2000—2020年中国碳汇总量
Fig. 3 The total carbon sinks of China from 2000 to 2020
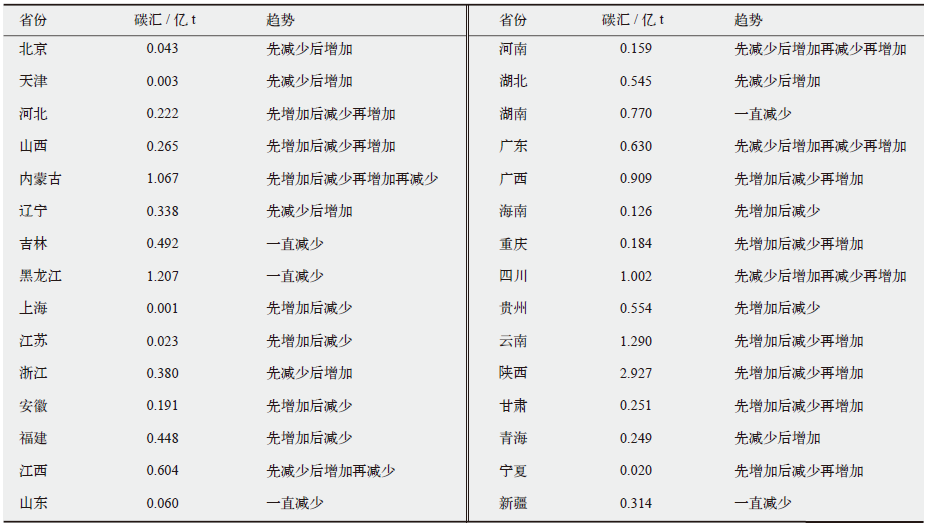 |
表3 2000—2020年中国各省碳汇均值及变化趋势
Table 3 The mean and trend of carbon sink across provinces from 2000 to 2020
| |
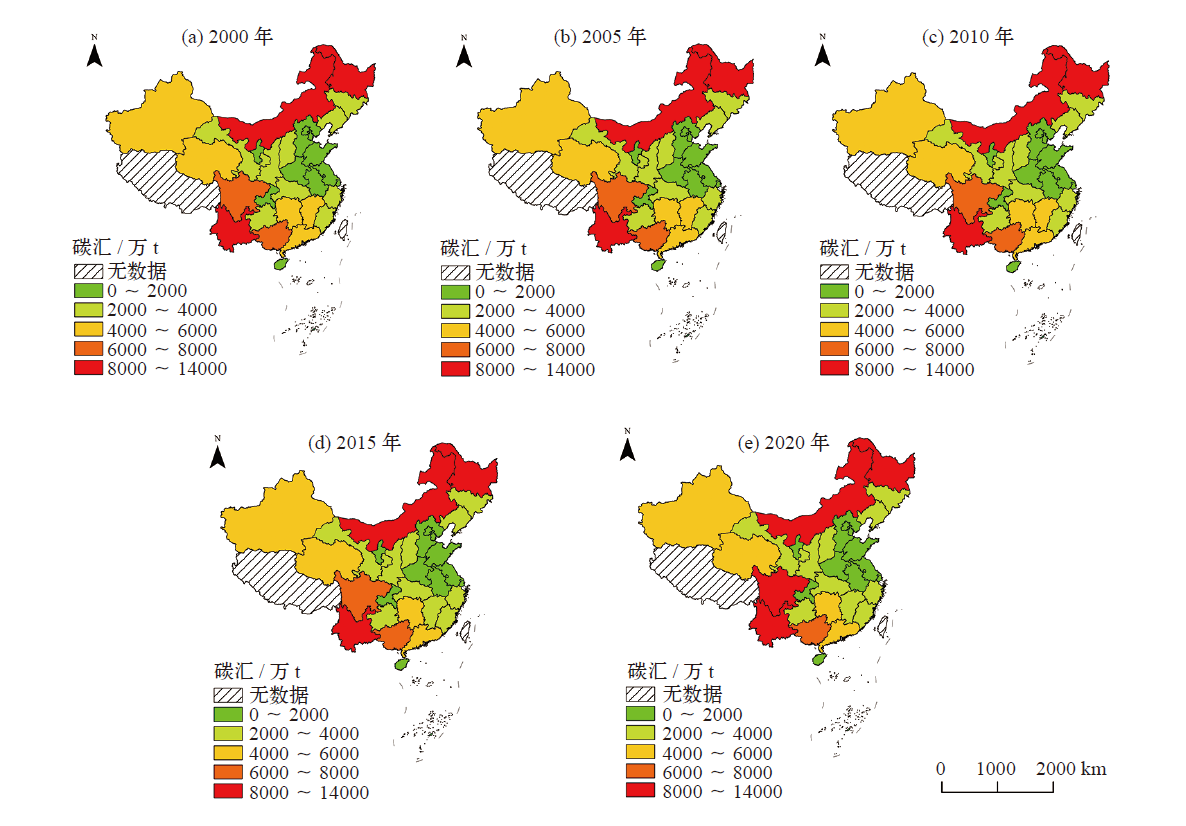
图4 2000—2020年中国各省碳汇空间分布情况
Fig. 4 Spatial distribution of carbon sinks across provinces from 2000 to 2020
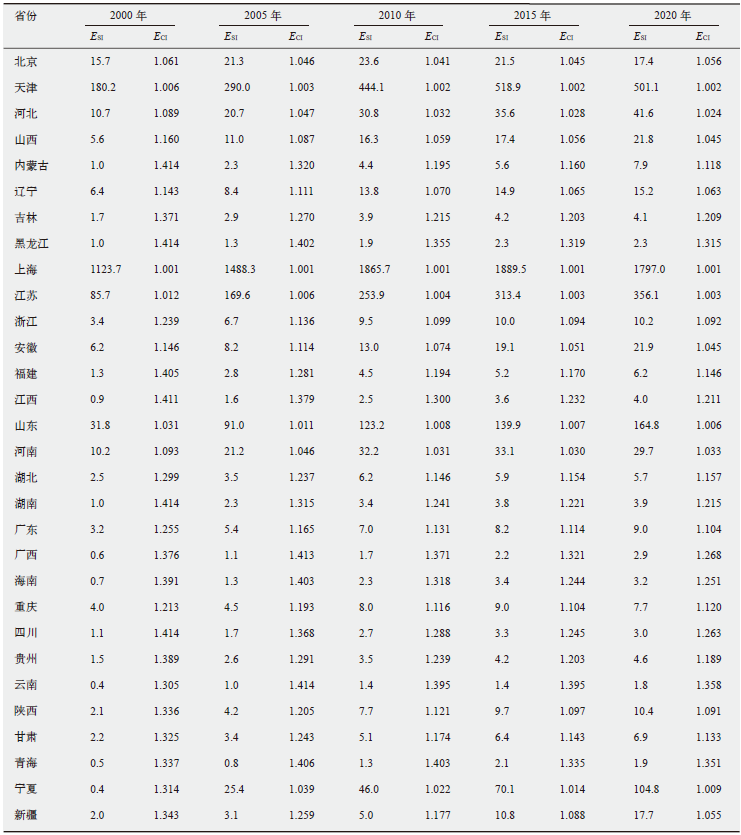 |
表4 2000—2020年中国省际碳承载强度指数和生态经济协调指数结果
Table 4 The result of ESI and ECI across provinces from 2000 to 2020
| |
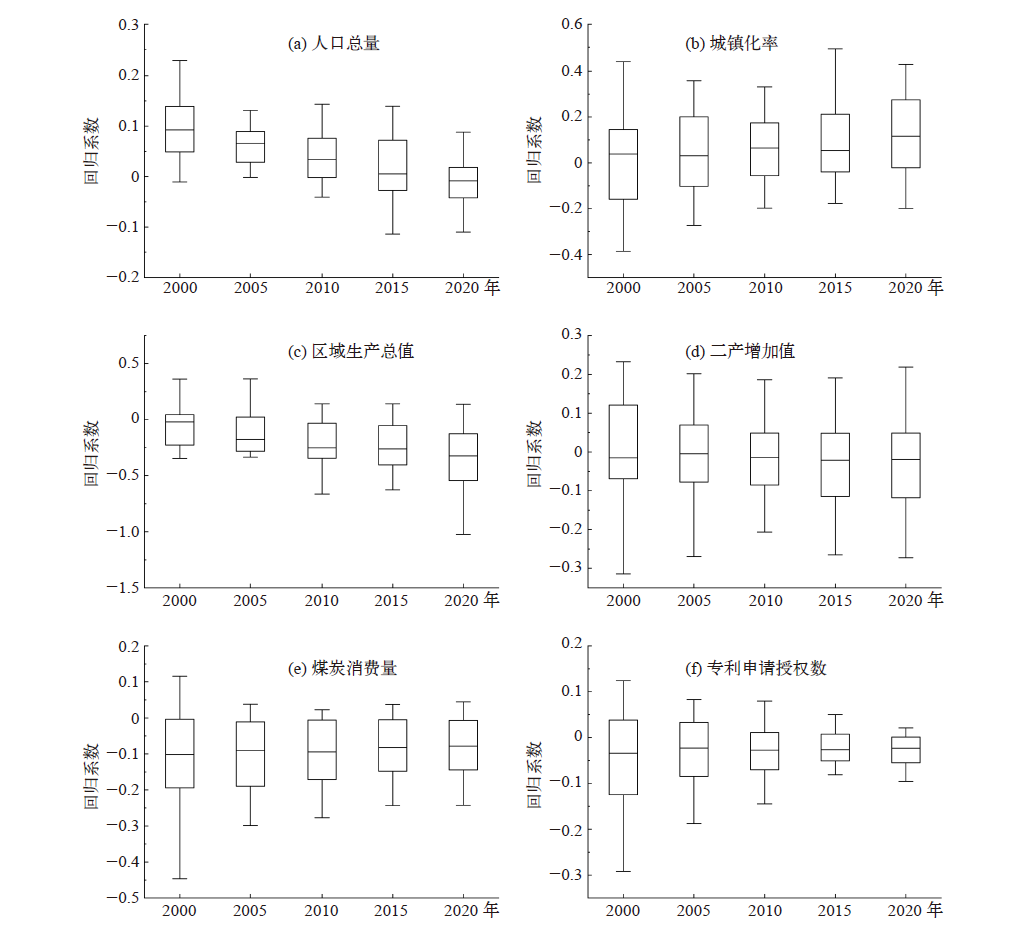
图5 中国省际生态经济协调指数影响因素的时间异质性
Fig. 5 Temporal variation of factors affecting provincial ECI
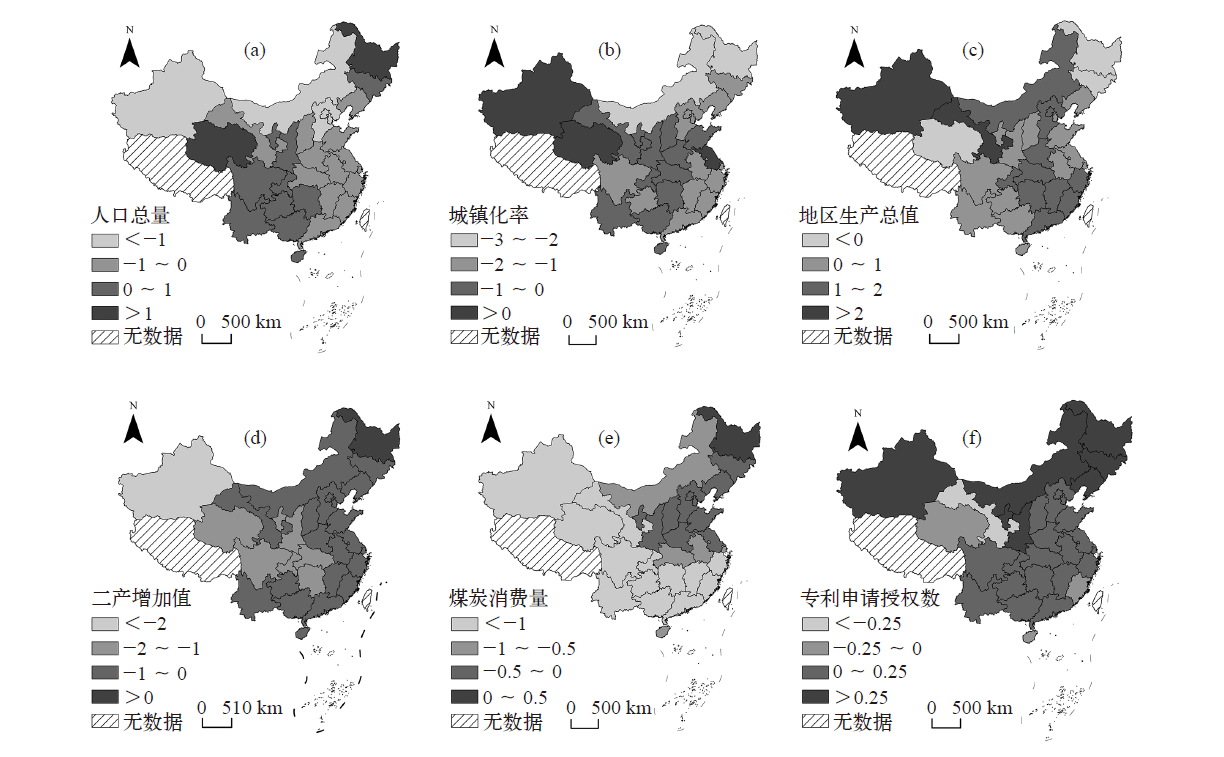
图6 中国省际生态经济协调指数影响因素空间分布情况
Fig. 6 Spatial distribution of factors affecting Ecological Economic Coordination Index across provinces
| [1] | Zheng X Q, Lu Y L, Yuan J J, et al. Drivers of change in China’s energy-related CO2 emissions[J]. Proceedings of the National Academy of Sciences of the United States of America, 2020, 117 (1): 29-36 |
| [2] | 崔学勤, 蔡闻佳, 施小明, 等. 当前应对气候变化的力度决定未来中国的公众健康水平[J]. 科学通报, 2020, 65 (1): 12-17. |
| Cui X Q, Cai W J, Shi X M, et al. The nature and scale of the response to climate change will determine the human health for centuries to come in China[J]. Chinese Science Bulletin, 2020, 65 (1): 12-17 (in Chinese) | |
| [3] | Hao Y, Chen H, Wei Y M, et al. The influence of climate change on CO2 (carbon dioxide) emissions: an empirical estimation based on Chinese provincial panel data[J]. Journal of Cleaner Production, 2016, 131: 667-677 |
| [4] | Montzka S, Dlugokencky E, Butler J. Non-CO2 greenhouse gases and climate change[J]. Nature, 2011, 476: 43-50 |
| [5] | 顾恬玮, 彭建. 基于自然的碳达峰、碳中和解决方案: 关键议题[J]. 生态学报, 2023, 43 (9): 3384-3391. |
| Gu T Q, Peng J. Nature-based Solutions for carbon peaking and carbon neutrality goals: key issues[J]. Acta Ecologica Sinica, 2023, 43 (9): 3384-3391 (in Chinese) | |
| [6] |
朱文博, 张静静, 崔耀平, 等. 基于土地利用变化情景的生态系统碳储量评估: 以太行山淇河流域为例[J]. 地理学报, 2019, 74 (3): 446-459.
doi: 10.11821/dlxb201903004 |
|
Zhu W B, Zhang J J, Cui Y P, et al. Assessment of territorial ecosystem carbon storage based on land use change scenario: a case study in Qihe River basin[J]. Acta Geographica Sinica, 2019, 74 (3): 446-459 (in Chinese)
doi: 10.11821/dlxb201903004 |
|
| [7] | 周广胜, 周梦子, 周莉, 等. 中国陆地生态系统增汇潜力研究展望[J]. 科学通报, 2022, 67 (31): 3625-3632. |
| Zhou G S, Zhou M Z, Zhou L, et al. Advances in the carbon sink potential of terrestrial ecosystems in China[J]. Chinese Science Bulletin, 2022, 67 (31): 3625-3632 (in Chinese) | |
| [8] | Wang J, Feng L, Palmer P I, et al. Large Chinese land carbon sink estimated from atmospheric carbon dioxide data[J]. Nature, 2020, 586 (7831): 720-723 |
| [9] | Sun Y, Zheng S, Wu Y, et al. Spatiotemporal variations of city-level carbon emissions in China during 2000-2017 using nighttime light data[J]. Remote Sensing, 2020, 12 (18): 2916 |
| [10] | Luo W, Kim H S, Zhao X, et al. New forest biomass carbon stock estimates in Northeast Asia based on multisource data[J]. Global Change Biology, 2020, 26 (12): 7045-7066 |
| [11] | Zhang P, He J, Hong X, et al. Carbon sources/sinks analysis of land use changes in China based on data envelopment analysis[J]. Journal of Cleaner Production, 2018, 204: 702-711 |
| [12] | 李远玲, 王金龙, 杨伶. 基于县域尺度的湖南省农业碳排放时空特征分析[J]. 中国农业资源与区划, 2022, 43 (4): 75-84. |
| Li Y L, Wang J L, Yang L. Study on temporal and spatial characteristics of agricultural carbon emissions in human province at county scale[J]. Chinese Journal of Agricultural Resources and Regional Planning, 2022, 43 (4): 75-84 (in Chinese) | |
| [13] | 张春华, 居为民, 王登杰, 等. 2004—2013年山东省森林碳储量及其碳汇经济价值[J]. 生态学报, 2018, 38 (5): 1739-1749. |
| Zhang C H, Ju W M, Wang D J, et al. Biomass carbon stocks and economic value dynamics of forests in Shandong Province from 2004 to 2013[J]. Acta Ecologica Sinica, 2018, 38 (5): 1739-1749 (in Chinese) | |
| [14] |
李璐, 董捷, 徐磊, 等. 功能区土地利用碳收支空间分异及碳补偿分区: 以武汉城市圈为例[J]. 自然资源学报, 2019, 34 (5): 1003-1015.
doi: 10.31497/zrzyxb.20190508 |
| Li L, Dong J, Xu L, et al. Spatial variation of land use carbon budget and carbon compensation zoning in functional areas: a case study of Wuhan Urban Agglomeration[J]. Journal of Natural Resources, 2019, 34 (5): 1003-1015 (in Chinese) | |
| [15] | 石敏俊, 王妍, 张卓颖, 等. 中国各省区碳足迹与碳排放空间转移[J]. 地理学报, 2012, 67 (10): 1327-1338. |
|
Shi M J, Wang Y, Zhang Z Y, et al. Regional carbon footprint and interregional transfer of carbon emissions in China[J]. Acta Geographica Sinica, 2012, 67 (10): 1327-1338 (in Chinese)
doi: 10.11821/xb201210004 |
|
| [16] | 庞军, 高笑默, 石媛昌, 等. 基于MRIO 模型的中国省级区域碳足迹及碳转移研究[J]. 环境科学学报, 2017, 37 (5): 2012-2020. |
| Pang J, Gao X M, Shi Y C, et al. Carbon footprint and carbon transfer at provincial level of China based on MRIO model[J]. Acta Scientiae Circumstantiae, 2017, 37 (5): 2012-2020 (in Chinese) | |
| [17] | 李缘缘, 魏伟, 周俊菊, 等. 中国土地利用碳排放变化及协调分区[J]. 环境科学, 2023, 44 (3): 1267-1276. |
| Li Y Y, Wei W, Zhou J J, et al. Changes in land use carbon emissions and coordinated zoning in China[J]. Environmental Science, 2023, 44 (3): 1267-1276 (in Chinese) | |
| [18] | 彭文甫, 周介铭, 徐新良, 等. 基于土地利用变化的四川省碳排放与碳足迹效应及时空格局[J]. 生态学报, 2016, 36 (22): 7244-7259. |
| Peng W F, Zhou J M, Xu X L, et al. Effect of land use changes on the temporal and spatial patterns of carbon emissions and carbon footprints in the Sichuan province of Western China, from 1990 to 2010[J]. Acta Ecologica Sinica, 2016, 36 (22): 7244-7259 (in Chinese) | |
| [19] | Liang S, Qu S, Zhu Z, et al. Income-based greenhouse gas emissions of nations[J]. Environmental Science & Technology, 2017, 51 (1): 346-355 |
| [20] | 方精云, 郭兆迪, 朴世龙, 等. 1981—2000年中国陆地植被碳汇的估算[J]. 中国科学 (D辑: 地球科学), 2007, 37 (6): 804-812. |
| Fang J Y, Guo Z D, Piao S L, et al. Terrestrial vegetation carbon sink in China from 1981-2000[J]. Science in China Series D: Earth Sciences, 2007, 37 (6): 804-812 (in Chinese) | |
| [21] | 王兆峰, 李竹, 吴卫. 长江经济带不同等级城市碳排放的时空演变及其影响因素[J]. 环境科学研究, 2022, 35 (10): 2273-2281. |
| Wang Z F, Li Z, Wu W. Spatio-temporal evolution and influencing factors of carbon emissions in different grade cities in the Yangtze River Economic Belt[J]. Research of Environmental Sciences, 2022, 35 (10): 2273-2281 (in Chinese) | |
| [22] | Xu X M, Lan Y. Spatial and temporal patterns of carbon footprints of grain crops in China[J]. Journal of Cleaner Production, 2017, 146: 218-227 |
| [23] | Chu Y M, Xie L Y, Yuan Z J. Composition and spatiotemporal distribution of the agro-ecosystem carbon footprint: a case study in Hebei province, North China[J]. Journal of Cleaner Production, 2018, 190: 838-846 |
| [24] | Cui Y, Khan S U, Sauer J, et al. Exploring the spatiotemporal heterogeneity and influencing factors of agricultural carbon footprint and carbon footprint intensity: embodying carbon sink effect[J]. Science of the Total Environment, 2022, 846: 157507 |
| [25] | Quan C, Cheng X, Yu S, et al. Analysis on the influencing factors of carbon emission in China’s logistics industry based on LMDI method[J]. Science of the Total Environment, 2020, 734: 138473 |
| [26] |
王少剑, 谢紫寒, 王泽宏. 中国县域碳排放的时空演变及影响因素[J]. 地理学报, 2021, 76 (12): 3103-3118.
doi: 10.11821/dlxb202112016 |
| Wang S J, Xie Z H, Wang Z H. The spatiotemporal pattern evolution and influencing factors of CO2 emissions at the county level of China[J]. Acta Geographica Sinica, 2021, 76 (12): 3103-3118 (in Chinese) | |
| [27] | 张启航, 张亚连, 谭桂菲, 等. 中国林业碳汇效率时空演化特征: 基于三阶段超效率数据包络分析模型[J]. 生态学报, 2024, 44 (15): 6769-6782. |
| Zhang Q H, Zhang Y L, Tan G F, et al. Spatio-temporal evolutionary characteristics of forestry carbon sink efficiency in China based on a three-stage super-efficiency SBM-DEA model[J]. Acta Ecologica Sinica, 2024, 44 (15): 6769-6782 (in Chinese) | |
| [28] | 花瑞祥, 蓝艳, 李嘉文, 等. 中国省际碳排放脱钩效应及驱动因素分析[J]. 环境科学研究, 2023, 36 (11): 2159-2168. |
| Hua R X, Lan Y, Li J W, et al. Analysis of the decoupling effect and driving factors of inter-provincial carbon emissions in China[J]. Research of Environmental Sciences, 2023, 36 (11): 2159-2168 (in Chinese) | |
| [29] | Shan Y, Guan D, Zheng H, et al. China CO2 emission accounts 1997-2015[J]. Scientific Data, 2018, 5 (1): 1-14 |
| [30] | Shan Y, Huang Q, Guan D, et al. China CO2 emission accounts 2016-2017[J]. Scientific Data, 2020, 7 (1): 54 |
| [31] | Guan Y, Shan Y, Huang Q, et al. Assessment to China’s recent emission pattern shifts[J]. Earth’s Future, 2021, 9 (11): e2021EF002241 |
| [32] | 周姝含, 曹永强, 么嘉棋, 等. 东北三省碳源/汇和碳盈亏时空分布与影响因素[J]. 生态学报, 2023, 43 (22): 9266-9280. |
| Zhou S H, Cao Y Q, Yao J Q, et al. Spatio-temporal distribution and influencing factors of carbon source/sink, carbon surplus and deficit in three Northeast provinces[J]. Acta Ecologica Sinica, 2023, 43 (22): 9266-9280 (in Chinese) | |
| [33] |
赵荣钦, 刘英, 马林, 等. 基于碳收支核算的河南省县域空间横向生态补偿研究[J]. 自然资源学报, 2016, 31 (10): 1675-1687.
doi: 10.11849/zrzyxb.20151291 |
| Zhao R Q, Liu Y, Ma L, et al. County-level carbon compensation of Henan province based on carbon budget estimation[J]. Journal of Natural Resources, 2016, 31 (10): 1675-1687 (in Chinese) | |
| [34] | 苏雅丽, 张艳芳. 陕西省土地利用变化的碳排放效益研究[J]. 水土保持学报, 2011, 25 (1): 152-156. |
| Su Y L, Zhang Y F. Study on effects of carbon emission by land use patterns of Shaanxi province[J]. Journal of Soil and Water Conservation, 2011, 25 (1): 152-156 (in Chinese) | |
| [35] | 段晓男, 王效科, 逯非, 等. 中国湿地生态系统固碳现状和潜力[J]. 生态学报, 2008, 28 (2): 463-469. |
| Duan X N, Wang X K, Lu F, et al. Carbon sequestration and its potential by wetland ecosystems in China[J]. Acta Ecologica Sinica, 2008, 28 (2): 463-469 (in Chinese) | |
| [36] |
吴立军, 田启波. 碳中和目标下中国地区碳生态安全与生态补偿研究[J]. 地理研究, 2022, 41 (1): 149-166.
doi: 10.11821/dlyj020210778 |
| Wu L J, Tian Q B. Study on regional carbon ecological security and ecological compensation in China under carbon neutralization target[J]. Geographical Research, 2022, 41 (1): 149-166 (in Chinese) | |
| [37] | 周寅桥, 李雄. 基于水体型生态指数的无锡市城区生态质量时空变化分析[J]. 生态学报, 2024, 44 (4): 1476-1490. |
| Zhou Y Q, Li X. Spatio-temporal changes of ecological quality in Wuxi urban area based on water-beneficial ecological index[J]. Acta Ecologica Sinica, 2024, 44 (4): 1476-1490 (in Chinese) | |
| [38] | 崔旺来, 陈梦圆, 钟海玥. 基于探索性空间数据分析和地统计分析的湾区生态安全空间分异及差异化管理: 以浙江大湾区为例[J]. 生态学报, 2023, 43 (5): 2074-2087. |
| Cui W L, Chen M Y, Zhong H Y. Spatial differentiation and differentiated management of ecological security in the Bay Area based on ESDA and GA: a case study of the Zhejiang Greater Bay Area[J]. Acta Ecologica Sinica, 2023, 43 (5): 2074-2087 (in Chinese) | |
| [39] | Huang B, Wu B, Barry M. Geographically and temporally weighted regression for modeling spatio-temporal variation in house prices[J]. International Journal of Geographical Information Science, 2010, 24 (3): 383-401 |
| [40] |
梁源钊, 魏冶, 何静仪. 辽中南地区城市增长与收缩时空演化及其影响因素: 基于城市实体地域视角[J]. 资源科学, 2024, 46 (6): 1103-1118.
doi: 10.18402/resci.2024.06.05 |
|
Liang Y Z, Wei Y, He J Y. Spatiotemporal evolution and influencing factors of urban growth and shrinkage in Central and Southern Liaoning: based on the perspective of physical urban area[J]. Resources Science, 2024, 46 (6): 1103-1118 (in Chinese)
doi: 10.18402/resci.2024.06.05 |
|
| [41] | 刘贤赵, 李阳. 县域尺度下长株潭地区城市化与碳排放的关系[J]. 环境科学, 2023, 44 (12): 6664-6679. |
| Liu X Z, Li Y. Relationship between urbanization and carbon emissions in the Chang-Zhu-Tan region at the county level[J]. Environmental Science, 2023, 44 (12): 6664-6679 (in Chinese) | |
| [42] | 石岳, 杨晨, 朱江玲, 等. 中国及省域碳排放、陆地碳汇及其相对减排贡献, 1980—2020[J]. 中国科学: 生命科学, 2024, 54 (12): 2459-2478. |
| Shi Y, Yang C, Zhu J L, et al. Estimation of national and provincial carbon emissions, terrestrial carbon sinks and their relative contribution to emission reductions during 1980-2020[J]. Scientia Sinica Vitae, 2024, 54 (12): 2459-2478 (in Chinese) | |
| [43] | Ye X, Chuai X. Carbon sinks/sources’ spatiotemporal evolution in China and its response to built-up land expansion[J]. Journal of Environmental Management, 2022, 321: 115863 |
| [44] | Yu Z, Ciais P, Piao S, et al. Forest expansion dominates China’s land carbon sink since 1980[J]. Nature Communications, 2020, 5374: 1-12 |
| [45] | 李晓英, 禹熙, 王方, 等. 西北干旱荒漠地区退耕还林还草工程综合效益评价[J]. 水土保持研究, 2023, 30 (1): 216-223, 232. |
| Li X Y, Yu X, Wang F, et al. Comprehensive benefit evaluation on the project of converting farmland to forestland and grassland in arid desert area of Northwest China[J]. Research of Soil and Water Conservation, 2023, 30 (1): 216-223, 232 (in Chinese) |
| [1] | 王晨旭, 姜彤, 陈思蓉, 董志博, 黄金龙, 苏布达. SSPs情景下华南地区海平面上升淹没风险分析[J]. 气候变化研究进展, 2025, 21(4): 519-528. |
| [2] | 陈艺, 陈银蓉, 蔡海生, 陈坤, 刘敏. 大南昌都市圈土地利用碳排放与新型城镇化的异质性特征及影响强度分析[J]. 气候变化研究进展, 2025, 21(3): 387-399. |
| [3] | 秦毓翔, 黄蕊. 基于Super-SBM模型的中东欧国家碳排放效率及影响因素研究[J]. 气候变化研究进展, 2024, 20(5): 581-592. |
| [4] | 宋京妮, 吴群琪, 袁长伟, 张帅, 包旭, 杜凯. 基于地统计分析的中国省域交通运输系统碳排放时空特征研究[J]. 气候变化研究进展, 2017, 13(5): 502-511. |
| [5] | 朱建华,冯源,曾立雄,黄志霖,肖文发. 中国省级土地利用变化和林业温室气体清单编制方法[J]. 气候变化研究进展, 2014, 10(6): 433-439. |
| [6] | 华文剑,陈海山. 区域尺度土地利用/土地覆盖变化对气温日较差的影响[J]. 气候变化研究进展, 2013, 9(2): 117-122. |
| [7] | 张小全. 土地利用变化和林业清单方法学进展[J]. 气候变化研究进展, 2006, 02(06): 265-268. |
| 阅读次数 | ||||||
|
全文 |
|
|||||
|
摘要 |
|
|||||