气候变化研究进展 ›› 2025, Vol. 21 ›› Issue (6): 818-829.doi: 10.12006/j.issn.1673-1719.2025.074
中国民航行业碳排放清单与配额分配方法研究
刘莹1( ), 吕晨2, 蔡博峰2
- 1 北京工业职业技术学院,北京 100042
2 生态环境部环境规划院,北京 100041
-
收稿日期:2025-04-03修回日期:2025-06-03出版日期:2025-11-30发布日期:2025-09-01 -
作者简介:刘莹,女,讲师,15733268276@163.com -
基金资助:北京工业职业技术学院科研重点课题(BGY2024 KY-42Z)
Research on the carbon emission inventory and allowance allocation method of China’s civil aviation industry
LIU Ying1(), LYU Chen2, CAI Bo-Feng2
- 1 Beijing Polytechnic College, Beijing 100042, China
2 Chinese Academy of Environmental Planning, Beijing 100041, China
-
Received:2025-04-03Revised:2025-06-03Online:2025-11-30Published:2025-09-01
摘要: 收集中国271个民航机场在2022—2024年间超过1582.2万条航班架次数据,基于国际民航组织(ICAO)推荐的逐架次、分阶段的航空碳排放核算方法,构建中国民航高时空分辨率碳排放清单,系统揭示中国民航机场与航线的碳排放量时空演变特征。结果显示,2022、2023和2024年中国民航CO2排放量分别为5646.7万、10826.1万和13438.1万t;随着疫情封控政策的解除,2023年中国民航碳排放量同比增长91.7%,远超同期全球航空业的平均增速。全国84.5%的机场(218个)碳排放同比上升,16条年CO2排放量超过30万t的核心航线增幅均超130%。2024年民航碳排放量同比增速回落至24.1%,但仍有60.9%的机场(157个)排放量增长。基于排放清单,提出一种基于强度管理的基准线航空配额分配方法,设定航空公司为履约主体,并以飞机单位里程CO2排放量表征基准线。在宽松、平衡和严格3种情景下,2024年度配额分配基准线分别为21.645、20.844和19.927 t CO2/km。在该方法框架下,中国国航、海南航空和山东航空配额缺口相对较大,而天津航空、四川航空和深圳航空配额盈余相对较高,该方法在不限制航空公司发展的同时,发挥激励低排放强度航空公司、约束高排放强度航空公司的作用,并与全国碳市场现行基准线法制度高度兼容,为航空业纳入全国碳市场后的配额分配方法设计提供参考。
引用本文
刘莹, 吕晨, 蔡博峰. 中国民航行业碳排放清单与配额分配方法研究[J]. 气候变化研究进展, 2025, 21(6): 818-829.
LIU Ying, LYU Chen, CAI Bo-Feng. Research on the carbon emission inventory and allowance allocation method of China’s civil aviation industry[J]. Climate Change Research, 2025, 21(6): 818-829.
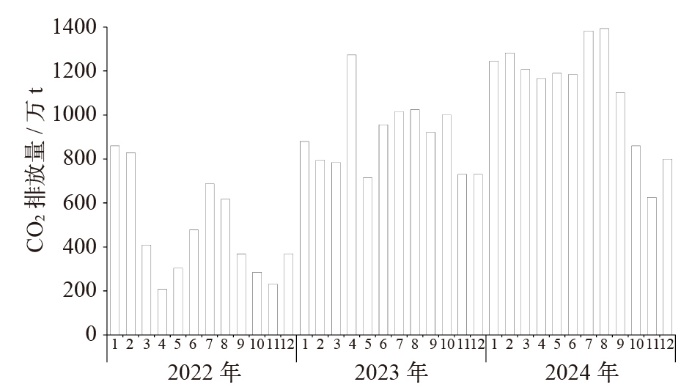
图1 2022—2024年中国民航逐月CO2排放量
Fig. 1 Monthly CO2 emissions from China’s civil aviation in 2022-2024
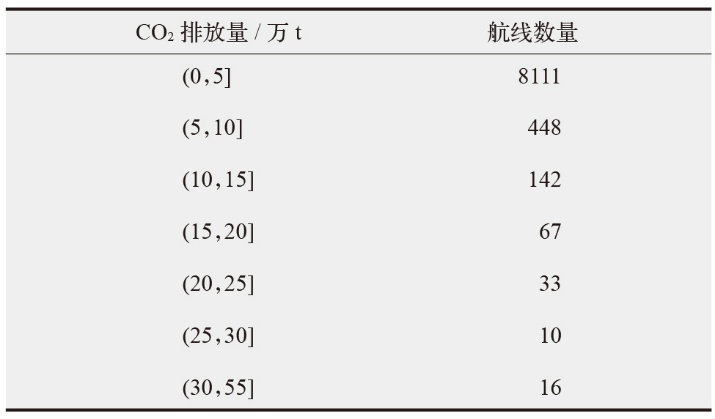 |
表1 2024年国内航线排放量及数量
Table 1 Domestic flight route emissions and quantity in 2024
| |
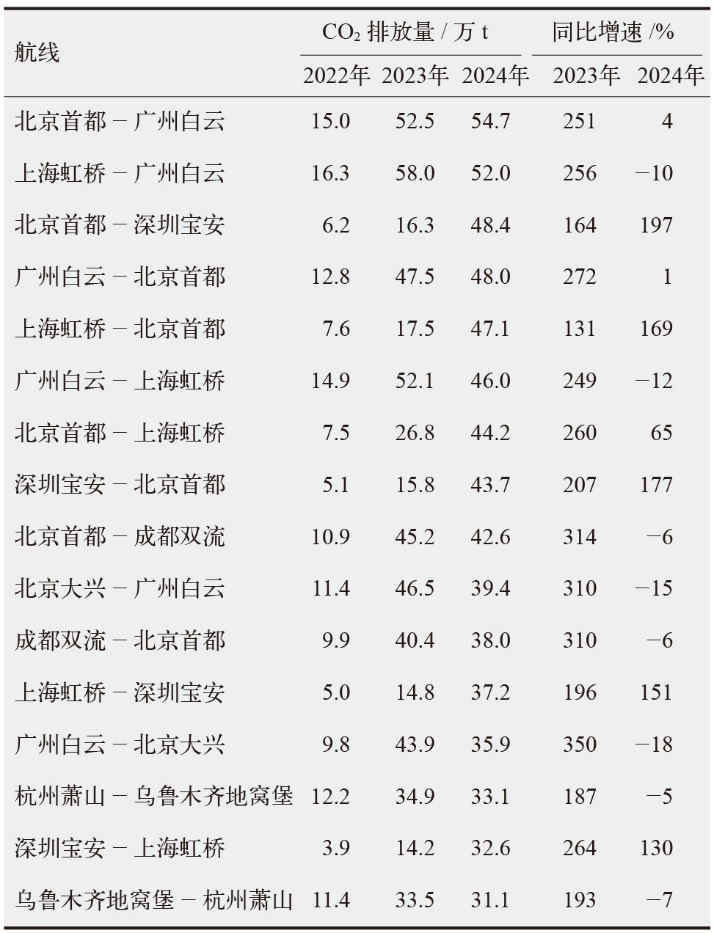 |
表2 2024年CO2排放量高于30万t的航线
Table 2 The flight routes with CO2 emissions exceeding 300 thousand tons in 2024
| |
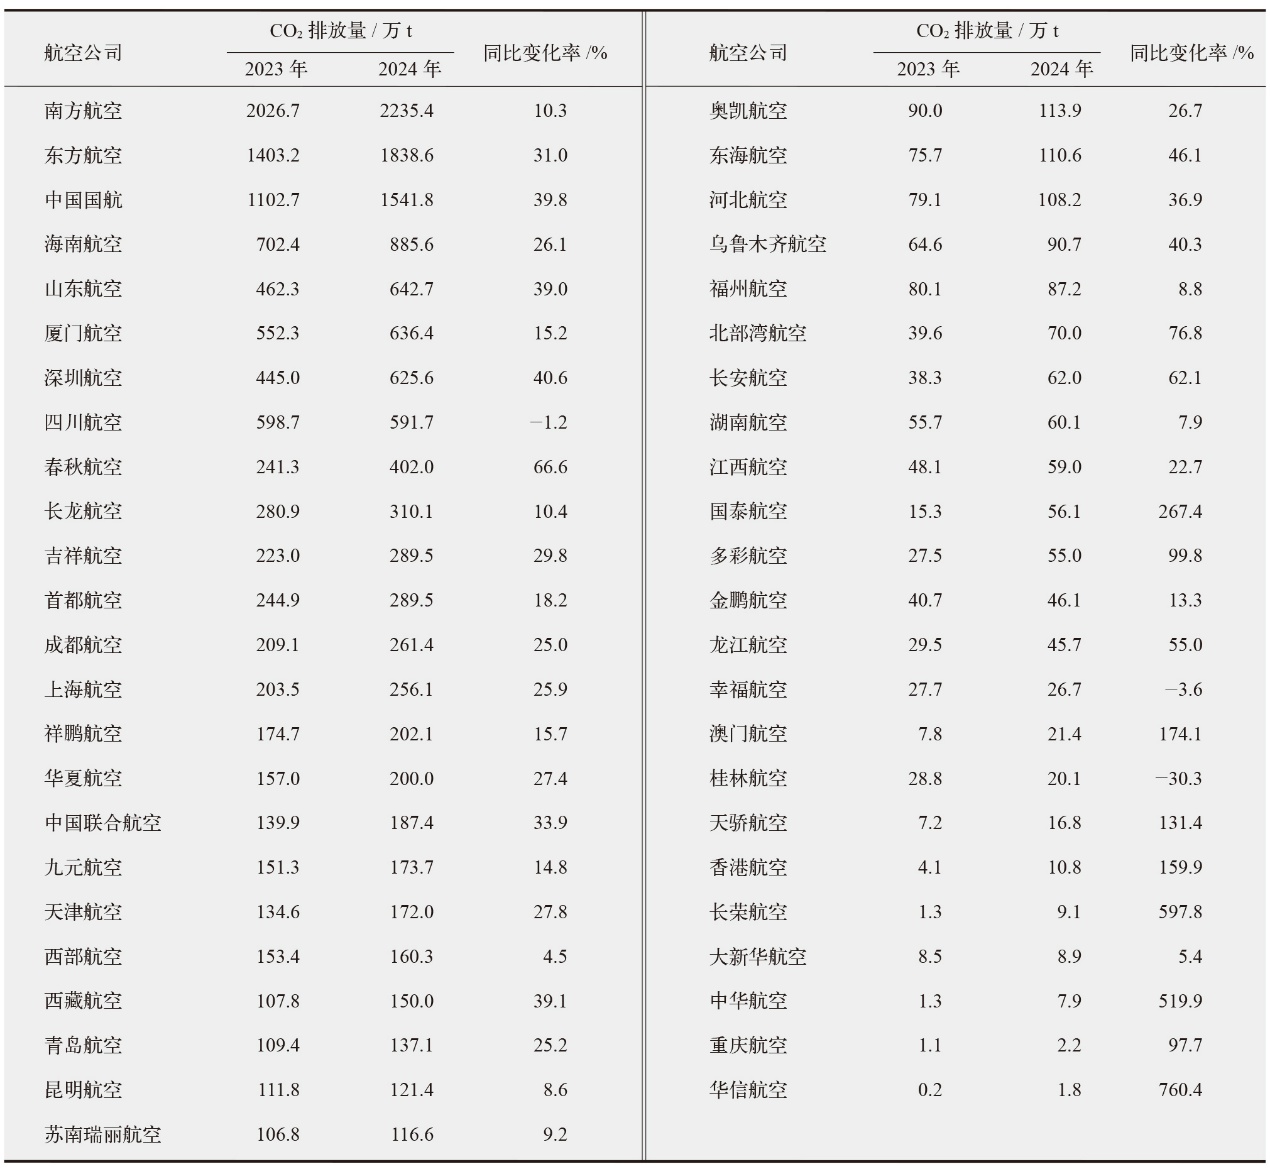 |
表3 2023—2024年航空公司CO2排放量及变化率
Table 3 CO2 emissions and growth rate of airlines in 2023-2024
| |
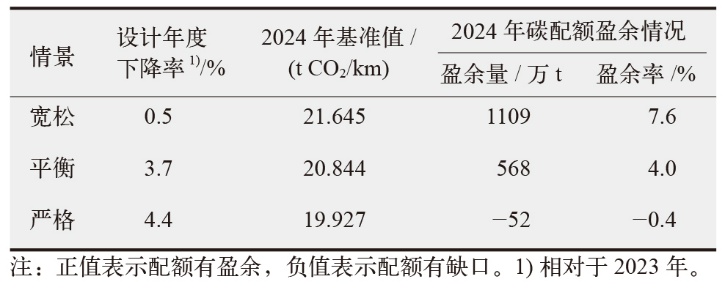 |
表4 2024年度航空配额分配基准线与全行业配额盈缺情况
Table 4 Baseline for aviation allowance allocation in 2024 and the surplus situation of allowances in the whole aviation industry
| |
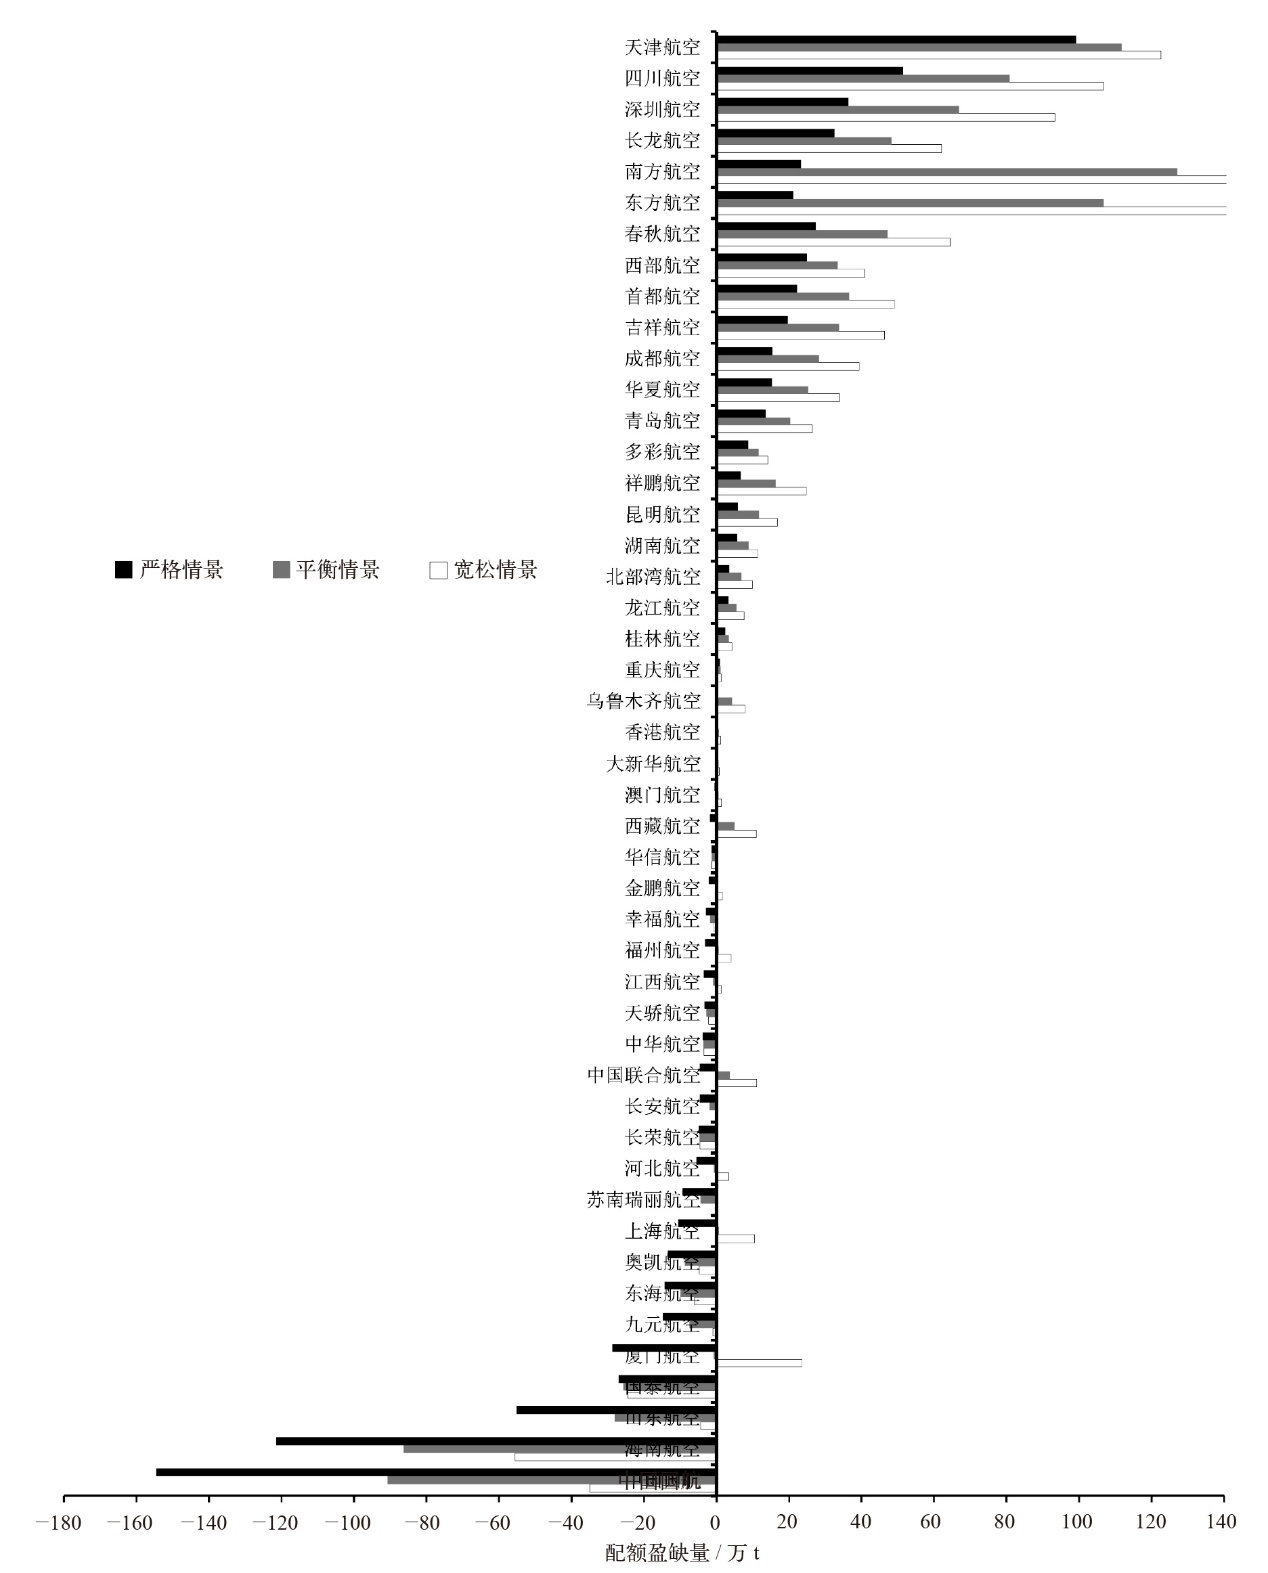
图2 2024年3种情景下航空公司配额盈缺模拟
Fig. 2 Simulation of allowance surplus and deficit for airlines across three scenarios in 2024
| [1] | International Energy Agency (IEA). CO2 emissions in aviation in the net zero scenario, 2000-2030[EB/OL]. 2025 [2025-04-01]. https://www.iea.org/data-and-statistics/charts/co2-emissions-in-aviation-in-the-net-zero-scenario-2000-2030 |
| [2] | 中国民航局. 2023年民航行业发展统计公报[R]. 北京, 2024. |
| Civil Aviation Administration of China (CAAC). 2023 civil aviation industry development statistical bulletin[R]. Beijing, 2024 (in Chinese) | |
| [3] | 中华人民共和国中央人民政府. “十四五”现代综合交通运输体系发展规划[S/OL]. 2022 [2025-04-01]. http://www.gov.cn/zhengce/content/2022-01/18/content_5669049.htm. |
| The Central People’s Government of the People’s Republic of China. Developmentplanforthemodernintegratedtransportationsystemduringthe14thFive-YearPlanperiod[S/OL]. 2022 [2025-04-01]. http://www.gov.cn/zhengce/content/2022-01/18/content_5669049.htm (in Chinese) | |
| [4] | 中华人民共和国中央人民政府. 国家综合立体交通网规划纲要[S/OL]. 2021 [2025-04-01]. http://www.gov.cn/gongbao/content/2021/content_5593440.htm. |
| The Central People’s Government of the People’s Republic of China. Outline of the national comprehensive three-dimensional transportation network planning[S/OL]. 2021 [2025-04-01]. http://www.gov.cn/gongbao/content/2021/content_5593440.htm (in Chinese) | |
| [5] | Zhang Z X. Carbon emissions trading in China: the evolution from pilots to a nationwide scheme[J]. Climate Policy, 2015, 15 (S1): 104-126 |
| [6] |
Wang K, Zhang Y Y, Wei Y M. Multiple options make net-zero emissions possible for China’s aviation passenger transport with 2.9 billion tonnes CO2 mitigation from 2020 to 2050[J]. One Earth, 2023, 6 (8): 1050-1065
doi: 10.1016/j.oneear.2023.07.003 URL |
| [7] | 韩博, 刘雅婷, 陈鑫, 等. 民航飞机起飞过程细粒子排放特征[J]. 中国环境科学, 2017, 37 (5): 1620-1627. |
| Han B, Liu Y T, Chen X, et al. Fine particles emission characterization of civil aviation aircraft during takeoff[J]. China Environmental Science, 2017, 37 (5): 1620-1627 (in Chinese) | |
| [8] | 任强, 韩孝兰, 李晓晨, 等. 考虑排放影响的飞机爬升性能参数组合优化方法[J]. 安全与环境学报, 2022, 22 (2): 955-961. |
| Ren Q, Han X L, Li X C, et al. Combination optimization method of aircraft climb performance parameters considering the impact of emissions[J]. Journal of Safety and Environment, 2022, 22 (2): 955-961 (in Chinese) | |
| [9] | 曹惠玲, 李玉铭. 基于FOA-MOD的飞机巡航阶段BC排放特性与影响因素研究[J]. 环境科学学报, 2021, 41 (2): 406-413. |
| Cao H L, Li Y M. Research on BC emission characteristics and influencing factors of aircraft during cruise phase based on FOA-MOD[J]. Acta Scientiae Circumstantiae, 2021, 41 (2): 406-413 (in Chinese) | |
| [10] | 李楠, 张红飞. 航空器场面滑行污染物排放计算研究[J]. 环境科学学报, 2017, 37 (5): 1872-1876. |
| Li N, Zhang H F. Calculating aircraft pollutant emissions during taxiing at the airport[J]. Acta Scientiae Circumstantiae, 2017, 37 (5): 1872-1876 (in Chinese) | |
| [11] | 李茜, 李依. 碳排放约束下不同机型的航班地面滑行特征分析[J]. 民航学报, 2023, 7 (3): 1-7. |
| Li Q, Li Y. Analysis on ground taxiing characteristics of different aircraft types under carbon emissions constraint[J]. Journal of Civil Aviation, 2023, 7 (3): 1-7 (in Chinese) | |
| [12] | 尤倩, 李洪枚, 伯鑫, 等. 中国民用航空机场大气污染物及碳排放清单[J]. 中国环境科学, 2022, 42 (10): 4517-4524. |
| You Q, Li H M, Bo X, et al. Air pollution and CO2 emission inventory of Chinese civil aviation airport[J]. China Environmental Science, 2022, 42 (10): 4517-4524 (in Chinese) | |
| [13] | 徐鑫, 尤倩, 张峥, 等. 碳达峰情景下中国民用航空机场大气污染物及碳排放清单研究[J]. 环境科学学报, 2024, 44 (7): 428-437. |
| Xu X, You Q, Zhang Z, et al. Air pollutants and carbon emission inventory of civil aviation airports in China in the scenario of peak carbon dioxide emissions[J]. Acta Scientiae Circumstantiae, 2024, 44 (7): 428-437 (in Chinese) | |
| [14] | Lyu C, Liu X M, Wang Z, et al. An emissions inventory using flight information reveals the long-term changes of aviation CO2emissions in China[J]. Energy, 2023, 262 (Part B): 125513 |
| [15] | 徐冉, 郎建垒, 杨孝文, 等. 首都国际机场飞机排放清单的建立[J]. 中国环境科学, 2016, 36 (8): 2554-2560. |
| Xu R, Lang J L, Yang X W, et al. Establishment of aircraft emission inventory for Beijing Capital International Airport[J]. China Environmental Science, 2016, 36 (8): 2554-2560 (in Chinese) | |
| [16] | 周子航, 陆成伟, 谭钦文, 等. 成都双流国际机场大气污染物排放清单与时空分布特征[J]. 中国环境监测, 2018, 34 (3): 75-83. |
| Zhou Z H, Lu C W, Tan Q W, et al. Emission inventory and spatial and temporal distribution characteristics of air pollutant in Chengdu Shuangliu international airport[J]. Environmental Monitoring in China, 2018, 34 (3): 75-83 (in Chinese) | |
| [17] | Yang H J, O’Connell J F. Short-term carbon emissions forecast for aviation industry in Shanghai[J]. Journal of Cleaner Production, 2020 (275): 122734 |
| [18] | 韩博, 孔魏凯, 姚婷玮, 等. 京津冀机场群飞机LTO大气污染物排放清单[J]. 环境科学, 2020, 41 (3): 1143-1150. |
| Han B, Kong W K, Yao T W, et al. Air pollutant emission inventory from LTO cycles of aircraft in the Beijing-Tianjin-Hebei airport group, China[J]. Environmental Science, 2020, 41 (3): 1143-1150 (in Chinese) | |
| [19] | 韩博, 何真, 张铎, 等. 粤港澳大湾区飞机LTO污染排放因子及排放清单[J]. 中国环境科学, 2020, 40 (12): 5182-5190. |
| Han B, He Z, Zhang D, et al. Research on aircraft LTO pollutant emission factors and emission inventory in Guangdong-Hong Kong-Macao Greater Bay Area, China[J]. China Environmental Science, 2020, 40 (12): 5182-5190 (in Chinese) | |
| [20] | 王瑞鹏, 周颖, 程水源, 等. 华北地区典型机场清单建立及空气质量影响[J]. 中国环境科学, 2020, 40 (4): 1468-1476. |
| Wang R P, Zhou Y, Cheng S Y, et al. The establishment of airports emission inventory and the air quality impacts for typical airports in North China[J]. China Environmental Science, 2020, 40 (4): 1468-1476 (in Chinese) | |
| [21] | 何吉成. 30年来中国民航运输行业的大气污染物排放[J]. 环境科学, 2012, 33 (1): 1-7. |
|
He J C. Air pollutant emissions of aircraft in China in recent 30 years[J]. Environmental Science, 2012, 33 (1): 1-7 (in Chinese)
doi: 10.1021/es980360a URL |
|
| [22] | 石钰婷, 吴薇薇, 李晓霞. 我国航空碳排放发展特征及影响因素研究[J]. 华东交通大学学报, 2019, 36 (6): 32-38. |
| Shi Y T, Wu W W, Li X X. Study on development and influencing factors of China’s aviation carbon emission[J]. Journal of East China Jiaotong University, 2019, 36 (6): 32-38 (in Chinese) | |
| [23] |
He J C, Xu Y Q. Estimation of the aircraft CO2 emissions of China’s civil aviation during 1960-2009[J]. Advances in Climate Change Research, 2012, 3 (2): 99-105
doi: 10.3724/SP.J.1248.2012.00099 URL |
| [24] |
Lu B B, Dong J T, Wang C, et al. High-resolution spatio-temporal estimation of CO2 emissions from China’s civil aviation industry[J]. Applied Energy, 2024, 373: 123907
doi: 10.1016/j.apenergy.2024.123907 URL |
| [25] | Zhang J Y, Zhang S J, Zhang X L, et al. Developing a high-resolution emission inventory of China’s aviation sector using real-world flight trajectory data[J]. Environmental Science & Technology, 2022 (9): 56 |
| [26] | Bayer P, Aklin M. The European Union emissions trading system reduced CO2 emissions despite low prices[J]. Proceedings of the National Academy of Sciences of the United States of America, 2020, 117, 16 (9): 8804-8812 |
| [27] |
Dechezleprêtre A, Nachtigall D, Venmans F. The joint impact of the European Union emissions trading system on carbon emissions and economic performance[J]. Journal of Environmental Economics and Management, 2023, 118: 102758
doi: 10.1016/j.jeem.2022.102758 URL |
| [28] | 廖维君, 范英. 国际航空碳抵消协议对不同国家的影响分析[J]. 中国人口?资源与环境, 2020, 30 (6): 10-19. |
| Liao W J, Fan Y. Analysis of the impact of carbon offsetting and reduction scheme for international aviation on different countries[J]. China Population Resources and Environment, 2020, 30 (6): 10-19 (in Chinese) | |
| [29] | 王科, 吕晨. 全球和中国碳市场回顾与展望(2025)[J]. 北京理工大学学报(社会科学版), 2025, 27 (2): 19-36 |
| Wang K, Lyu C. Review and outlook of global and China carbon markets (2025)[J]. Journal of Beijing Institute of Technology (Social Sciences Edition), 2025, 27 (2): 19-36 (in Chinese) | |
| [30] | 中华人民共和国生态环境部. 全国碳排放权交易市场覆盖水泥、钢铁、电解铝行业工作方案[EB/OL]. 2025 [2025-04-01]. https://www.mee.gov.cn/xxgk2018/xxgk/xxgk03/202503/t20250326_1104736.html. |
| Ministry of Ecology and Environment of the People’s Republic of China. Draft work plan for expanding the national carbon emissions trading market to cover the cement, steel, and electrolytic aluminum industries[EB/OL]. 2025 [2025-04-01]. https://www.mee.gov.cn/xxgk2018/xxgk/xxgk03/202503/t20250326_1104736.html (in Chinese) | |
| [31] | 国家发展改革委. 国家发展改革委办公厅关于切实做好全国碳排放权交易市场启动重点工作的通知[EB/OL]. 2016 [2025-04-01]. https://www.ndrc.gov.cn/xxgk/zcfb/tz/201601/t20160122_963576.html. |
| National Development and Reform Commission. Notice of the general office of the National Development and Reform Commission on effectively advancing key tasks for the launch of the national carbon emissions trading market[EB/OL]. 2016 [2025-04-01]. https://www.ndrc.gov.cn/xxgk/zcfb/tz/201601/t20160122_963576.html (in Chinese) | |
| [32] | 段茂盛. 碳市场配额分配机制的国内外实践及优化调整的建议[J]. 中国电力企业管理, 2024 (7): 26-28. |
| Duan M S. Domestic and international practices of carbon market allowance allocation mechanisms and recommendations for optimization and adjustment[J]. China Power Enterprise Management, 2024 (7): 26-28 (in Chinese) | |
| [33] | 王文举, 陈真玲. 中国省级区域初始碳配额分配方案研究: 基于责任与目标、公平与效率的视角[J]. 管理世界, 2019, 35 (3): 81-98. |
| Wang W J, Chen Z L. Study on the allocation plan of initial carbon allowances in China’s province-level regions: based on the perspective of responsibility and goals, fairness and efficiency[J]. Journal of Management World, 2019, 35 (3): 81-98 (in Chinese) | |
| [34] | 吕晨, 阮建辉, 王科, 等. 碳市场发电行业配额分配方法分析及优化建议[J]. 环境科学, 2024, 45 (8): 4619-4626. |
| Lyu C, Ruan J H, Wang K, et al. Analysis and optimization suggestions on allowance allocation methods of the power industry in the carbon market[J]. Environmental Science, 2024, 45 (8): 4619-4626 (in Chinese) | |
| [35] | European Commission. Report from the commission to the European Parliament and the council on the functioning of the European carbon market in 2021 pursuant to Articles 10 (5) and 21 (2) of directive 2003/87/EC (as amended by Directive 2009/29/EC and Directive (EU) 2018/410)[EB/OL]. 2022 [2025-04-01]. https://eur-lex.europa.eu/legal-content/EN/TXT/PDF/?uri=CELEX:52022DC0516 |
| [36] | 赵凤彩, 张卫景, 刘蒙蒙. 全球航空货运碳排放配额分配问题研究[J]. 生态经济, 2015, 31 (1): 60-64. |
| Zhao F C, Zhang W J, Liu M M. Research on allocation issues of global carbon emissions quota for air cargo[J]. Ecological Economy, 2015, 31 (1): 60-64 (in Chinese) | |
| [37] | 巴云雨, 陈俣秀. 基于公平原则的航空公司碳排放配额分配研究[J]. 科技和产业, 2024, 24 (9): 54-58. |
| Ba Y Y, Chen Y X. Research on the carbon emission allowance allocation for airlines in China based on the principles of equity[J]. Science Technology and Industry, 2024, 24 (9): 54-58 (in Chinese) | |
| [38] | 吕晨, 蔡博峰, 徐少东, 等. 一种快速核算航空二氧化碳排放量的方法及其系统[P]. 2022-04-12. |
| Lyu C, Cai B F, Xu S D, et al. A method and its system for quickly calculating aviation carbon dioxide emissions[P]. 2022-04-12 (in Chinese) | |
| [39] | 中国民用航空局. 2022年民航行业发展统计公报[R]. 北京, 2023. |
| Civil Aviation Administration of China (CAAC). 2022 civil aviation industry development statistical bulletin[R]. Beijing, 2023 (in Chinese) | |
| [40] | European Union Aviation Safety Agency (ESEA). European aviation environmental report 2025[EB/OL]. 2025 [2025-04-01]. https://www.easa.europa.eu/en/light/topics/european-aviation-environmental-report-2025 |
| [41] | IEA. Greenhouse gas emissions from energy[EB/OL]. 2023 [2025-04-01]. https://www.iea.org/data-and-statistics/data-product/greenhouse-gas-emissions-from-energy |
| [42] | 生态环境部. 2021、2022年度全国碳排放权交易配额总量设定与分配实施方案(发电行业)[R/OL]. 2023 [2025-04-01]. https://www.gov.cn/zhengce/zhengceku/2023-03/16/content_5747106.htm. |
| Ministry of Ecology and Environment of the People’s Republic of China (MEE). Implementation plan for the total allowance cap and allocation under China’s national carbon emissions trading system for 2021 and 2022 (power generation sector) (2023)[R/OL]. 2023 [2025-04-01]. https://www.gov.cn/zhengce/zhengceku/2023-03/16/content_5747106.htm (in Chinese) | |
| [43] | 生态环境部. 2023、2024年度全国碳排放权交易发电行业配额总量和分配方案[R/OL]. 2024 [2025-04-01]. https://www.gov.cn/zhengce/zhengceku/202410/content_6981938.htm. |
| Ministry of Ecology and Environment of the People’s Republic of China (MEE). Allocation plan and total allowance cap for the power generation sector under China’s national emissions trading scheme for 2023 and 2024 (2024c)[R/OL]. 2024 [2025-04-01]. https://www.gov.cn/zhengce/zhengceku/202410/content_6981938.htm (in Chinese) | |
| [44] | 中国民用航空局. 2021年民航行业发展统计公报[R]. 北京, 2022. |
| Civil Aviation Administration of China (CAAC). 2021 civil aviation industry development statistical bulletin[R]. Beijing, 2022 (in Chinese) | |
| [45] | 中国民用航空局. 2020年民航行业发展统计公报[R]. 北京, 2021. |
| Civil Aviation Administration of China (CAAC). 2020 civil aviation industry development statistical bulletin[R]. Beijing, 2021 (in Chinese) |
| [1] | 田利军, 徐森雨. 基于系统动力学模型的中国民航脱碳路径研究[J]. 气候变化研究进展, 2024, 20(4): 454-464. |
| [2] | 惠婧璇, 朱松丽. 全国碳排放权交易市场下电解铝行业基准线法研究[J]. 气候变化研究进展, 2022, 18(3): 366-372. |
| [3] | 谭琦璐, 刘兰婷, 朱松丽. 全国碳交易下中国钢铁行业的基准线法研究[J]. 气候变化研究进展, 2021, 17(5): 590-597. |
| [4] | 郑爽, 刘海燕. 碳交易试点地区电力部门配额分配比较研究及对全国的借鉴[J]. 气候变化研究进展, 2020, 16(6): 748-757. |
| [5] | 林文斌,顾阿伦,刘滨,王兆新,周玲玲. 碳市场、行业竞争力与碳泄漏:以钢铁行业为例[J]. 气候变化研究进展, 2019, 15(4): 427-435. |
| [6] | 常莎莎, 郗凤明, 毕垒, 陈坚, 王娇月, 王丽. 供热行业碳排放基准线研究——以沈阳市为例[J]. 气候变化研究进展, 2016, 12(6): 554-560. |
| [7] | 崔铁宁, 鲁婷. 城市公共自行车自愿碳减排机制初探——以北京市为例[J]. 气候变化研究进展, 2016, 12(2): 112-117. |
| [8] | 王任, 吕继兴. 中国民航参与国家碳市场框架方案研究[J]. 气候变化研究进展, 2015, 11(1): 68-75. |
| [9] | 赵凤彩,尹力刚,高兰. 国际航空碳排放权分配公平性研究[J]. 气候变化研究进展, 2014, 10(6): 445-452. |
| 阅读次数 | ||||||
|
全文 |
|
|||||
|
摘要 |
|
|||||