

引言
光伏系统作为从太阳能资源中获取大规模电力的主要系统,在促进气候变化适应、保障能源安全等方面具有积极作用[10-
文中利用CMIP6的气候模式资料,对比高排放情景(SSP5-8.5)和低排放情景(SSP1-2.6)下中国近海光伏发电潜力的未来变化。同时,进一步探究影响其变化的大气驱动因子,以期为海上太阳能开发利用、能源规划管理、推动“双碳”目标实现提供科学参考。
1 资料和方法
1.1 ERA5再分析参考数据集
以ERA5再分析资料作为参考数据集,评估相关变量的模式模拟结果与ERA5的一致性。ERA5资料是欧洲中期天气预报中心(ECMWF)2019年制作的最新一代大气再分析资料,现已被广泛应用于气候变化和模拟评估研究中,其在中国海区的适用性已得到证实[5]。本文使用的ERA5数据为1975—2014年间的月平均数据,空间分辨率为1°×1°。
1.2 CMIP6模式数据集
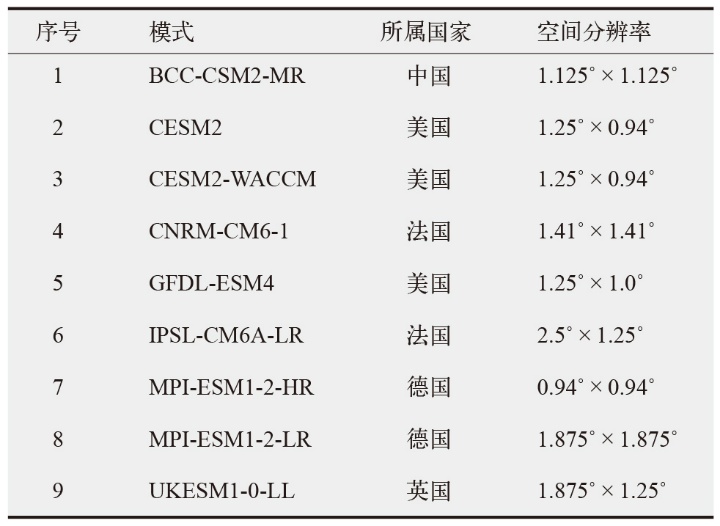
文中未来的光伏发电潜力是在SSP1-2.6和SSP5-8.5两种具有代表性的情景下估计的,SSP1-2.6情景下全球升温将低于2℃,辐射强迫在2100年稳定在约2.6 W/m2,是相对严格的气候目标路径[21]。根据SSP情景的设计,SSP1-2.6情景可以在21世纪中叶达到碳中和[22-
1.3 光伏发电潜力预估
其中,R和RSTC分别为实际环境条件下和标准测试条件下的短波辐射,RSTC=1000 W/m2。PR为效率比,用于考虑光伏电池因温度变化而产生的效率变化,公式为
其中,Tcell为电池温度,TSTC=25℃,对于单晶硅太阳能电池γ=-0.005℃-1。最后,考虑气温(T)、短波辐射(R)和风速(V)对电池温度的影响,Tcell计算公式为[27]
其中,c1=4.3℃,c2=0.943,c3=0.028 (℃∙m2)/W,c4=-1.528 (℃∙s)/m。
若Tcell高于25℃或R低于1000 W/m2,则光伏输出功率会低于额定功率。
2 结果分析
2.1 模式模拟能力评估及订正
不同模式的预估结果往往会由于初始场不准确、计算误差及模式之间物理过程参数化的差异而导致很大不确定性。研究采用分位数映射(QM)方法[28]对CMIP6模式数据进行偏差订正,通过对研究区格点数据的系统校正,减小全球气候模式在区域尺度模拟中存在的偏差,提高其在区域气候模拟中的精度。泰勒图作为一种直观的评估工具,能够整合多项统计指标,全面且清晰地展示模式性能差异以及模拟值与观测值之间的误差大小[29]。为验证偏差订正效果,以ERA5再分析资料为参照基准,通过泰勒图对模式订正前后中国近海历史时期(1975—2014年)的辐射、气温、风速3个关键变量的模拟能力进行评估(图1),订正前气温的相关系数在0.81~0.98之间,标准差介于0.80~1.28之间;风速的相关系数在0.75~0.82之间,标准差在1.10~1.80之间;短波辐射的模拟效果较好,相关系数均在0.94~0.96之间,标准差在0.76~1.20之间。订正后,数据表现有明显改善,标准差都维持在1.0左右,气温的相关系数提升到0.86~0.99之间,风速的相关系数在0.85~0.87之间,辐射的相关系数提升至0.97以上。由此可见,经过QM偏差订正后,3个变量的模拟能力明显改进,匹配度大幅提升,订正后的结果用于未来情景预估更加合理。由于多模式集合平均(MME)可减少单一模式的不确定性和系统性偏差,提高气候预测的稳健性和数据的一致性,是消除不确定性的有效手段[30-31]。因此,采用多模式集合平均法对订正后的模式数据进行集合平均。
图1
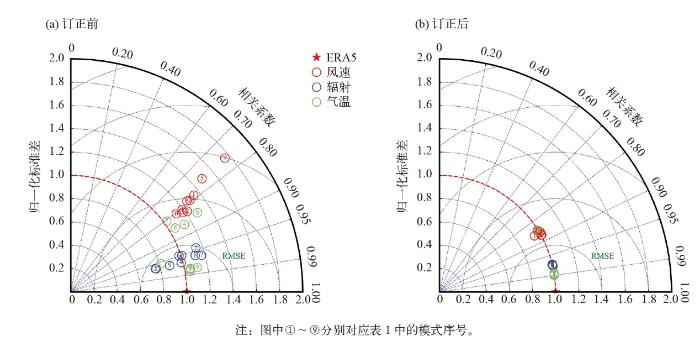
图1
1975—2014年中国近海多年平均辐射、气温和风速的模拟场相对于观测场(ERA5)的泰勒图(a) QM偏差订正前,(b) QM偏差订正后
Fig. 1
Taylor diagrams of the simulated fields relative to the observed fields (ERA5) for the multi-year average radiation, temperature, and wind speed over the offshore China from 1975 to 2014. (a) Before QM bias correction, (b) after QM bias correction
2.2 未来PVP的变化
图2为SSP1-2.6和SSP5-8.5情景下,未来两个时期中国近海区域的PVP相对于历史时期(订正后的CMIP6集成数据集)的变化百分比空间分布。近未来时期,中国近海沿岸区域的PVP变化在两种路径下呈现出相似的空间格局,都大体表现为中北部地区增加、南部地区减少的趋势,只是在量级上有所不同。SSP1-2.6和SSP5-8.5情景下预估的PVP变化范围分别为-0.95%~3.37%和-1.31%~1.78%。SSP1-2.6的增幅范围更大且更明显,最大增幅出现在广东沿海海域,预估PVP增幅将超过3%,约是SSP5-8.5情景下的1.8倍;SSP5-8.5情景下增加的范围及幅度更小,且研究区南部呈现出减少趋势的区域相对更大。
图2
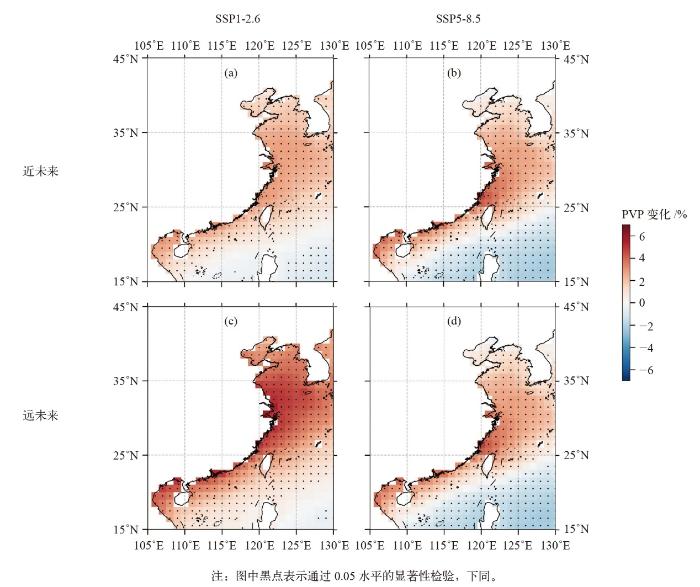
图2
SSP1-2.6和SSP5-8.5情景下近未来(a、b)和远未来(c、d)相对于历史时期的年平均光伏发电效率(PVP)的变化
Fig. 2
Changes in annual average photovoltaic power potential (PVP) in the near future (a, b) and far future (c, d) relative to the historical period under SSP1-2.6 and SSP5-8.5 scenarios. (Black dots indicate significance tests passed at the 0.05 level)
两种情景下远未来时期变化的空间分布形态与近未来相似,变化幅度都由沿岸海域向外围减小。SSP1-2.6和SSP5-8.5情景下预估的PVP变化范围分别为-0.44%~5.87%和-2.30%~4.77%。SSP1-2.6情景下增幅大值区位于沿岸海域以及黄海、东海区域,局部增幅超过5%。
对比未来的两个时期,在21世纪下半叶,变化趋势相较近未来时期更显著,部分格点的变化幅度达到近未来的两倍以上。SSP1-2.6情景下的远未来时期几乎整个研究区都呈显著上升趋势,PVP呈现减小的区域较近未来时期大幅缩小。SSP5-8.5情景下远未来时期PVP的变化幅度在正负方向上都有增强,研究区北部PVP增加更强烈,南部减弱也更明显。总体而言,碳中和路径下(SSP1-2.6情景下)的中国近海未来PVP较历史时期增加显著,特别在远未来时期,研究区几乎整体都表现为显著增加趋势。而SSP5-8.5情景下的PVP增幅较SSP1-2.6小,且南部地区的PVP显著减小。
图3为两种情景下中国近海区域近未来和远未来时期的PVP相对于历史时期的多年平均月变化。SSP1-2.6情景下,近未来和远未来的全年PVP都将增加,且最大增幅均出现在2月,分别为2.18%和4.20%;最小增幅分别出现在9月(0.16%)和8月(0.94%)。SSP5-8.5情景下,近未来的PVP在6—10月呈现出负变化,远未来在6—9月出现减少,其中8月减少最明显,分别为-0.88%(近未来)和-1.13%(远未来);近未来和远未来的最大增幅分别出现在2月(1.02%)和1月(2.61%)。
图3
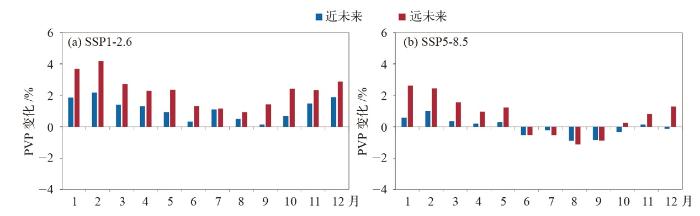
图3
SSP1-2.6 (a)和SSP5-8.5 (b)情景下未来PVP相对于历史时期的多年平均月变化
Fig. 3
Monthly change in future PVP under the SSP1-2.6 (a) and SSP5-8.5 (b) scenarios relative to the multi-year average for the historical period
总体来看,相同情景下的PVP在未来两个时期的月变化基本一致,全年最大值出现在1—2月,最小值出现在8—9月。较近未来而言,远未来的变化幅度有所增加。特别是在SSP5-8.5情景下,夏季出现了负变化,并在远未来持续减小,说明该情景下未来夏季温度的增加对光伏发电系统产生的负面影响超过了短波辐射增长所带来的正面影响。
2.3 PVP变化的驱动因子
PVP的变化是由地表向下短波辐射、气温和风速变化引起的,为了理清三者变化对PVP的影响,仅改变其中一个变量为未来值,将其余变量固定在历史时期,估算未来PVP变化,从而分离每个变量的贡献。由两种情景下近未来和远未来时期地表向下短波辐射(图4)变化引起的PVP变化可知,SSP1-2.6情景下,由于地表向下短波辐射的变化,几乎整个近海区域的预估PVP都呈现出增加趋势,远未来的PVP增加范围和幅度较近未来增大,近未来的最大增幅为3.87%,远未来的最大增幅达6.64%。SSP5-8.5情景下,PVP变化大致呈现北部增加、南部减小的态势,远未来的变化趋势在南北两个方向上均较近未来更显著,且幅度进一步加大。两个时期北部最大增幅分别为2.17%(近未来)和5.41%(远未来)。
图4
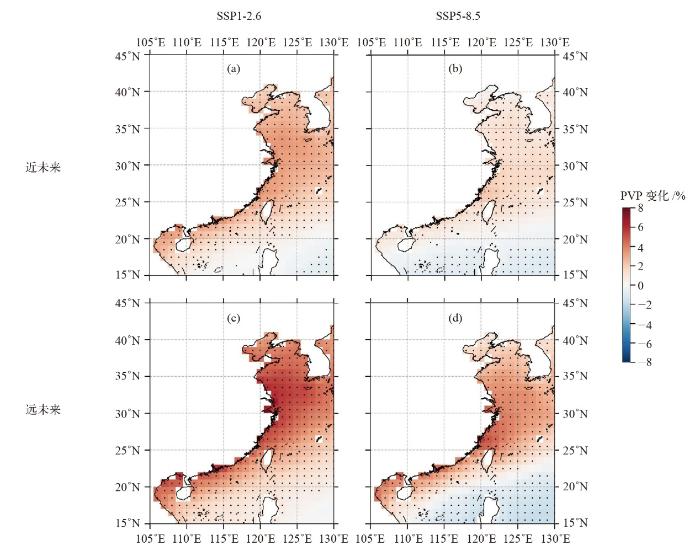
图4
SSP1-2.6和SSP5-8.5情景下近未来和远未来时期地表向下短波辐射贡献的PVP变化
Fig. 4
PVP changes contributed by surface downwelling shortwave radiation in near- and far-future under SSP1-2.6 and SSP5-8.5 scenarios
由图5看出,近地表气温对PVP的贡献为负,研究区范围内PVP都呈减少趋势。近未来的温度变化对研究区的PVP变化影响较弱,仅有北部地区少数格点通过显著性检验。由变暖引起的最大降幅分别为0.66%(SSP1-2.6)和0.73%(SSP5-8.5)。而到21世纪末,温度变化对PVP的影响较近未来显著增强,特别是SSP5-8.5情景下研究区整体的PVP降低趋势均通过显著性检验。此时,温度变化导致的区域最大降幅分别为 0.78%(SSP1-2.6)和1.08%(SSP5-8.5)。这表明一定程度下的环境温度升高会降低PVP,且随着气候变暖程度加剧,减少将更显著。由风速变化引起的PVP变化幅度很小,且均未通过显著性检验(图略)。
图5
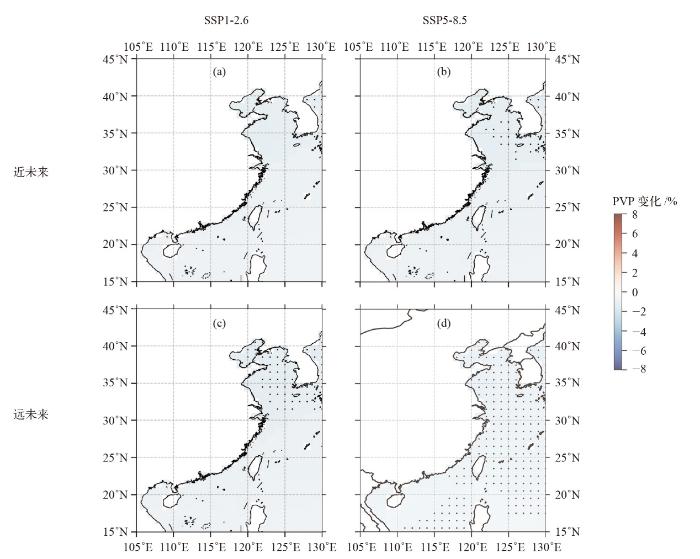
图5
SSP1-2.6和SSP5-8.5情景下近未来和远未来时期近地表气温贡献的PVP变化
Fig. 5
PVP changes contributed by near-surface air temperature in near- and far-future under SSP1-2.6 and SSP5-8.5 scenarios
综上可知,地表向下短波辐射对预估PVP变化的影响大于近地表气温,是导致PVP变化的主要驱动因素。
3 结论
本研究利用CMIP6全球气候模式模拟数据,估算了SSP1-2.6和SSP5-8.5两种典型情景下,气候变化对中国近海光伏发电潜力的潜在影响,主要结论如下。
(1)近未来时期,两种情景下的光伏发电潜力都呈现出研究区北部增长、南部减小的趋势,只是在量级上有所不同。SSP1-2.6情景下的PVP最大增幅预估将超过3%,约是SSP5-8.5情景下的1.8倍。远未来时期,SSP1-2.6情景下PVP转变为几乎整个研究区域都呈现出增长态势;而在SSP5-8.5情景下PVP变化的空间形态与近未来相似,但变化幅度在正负两个方向上都有所增强。
(2) SSP1-2.6情景下,近未来和远未来的全年PVP都将增加,最大增幅均出现在2月,分别为2.18%和4.20%。SSP5-8.5情景下两个时期PVP都在6—9月呈现出负变化。其中,8月减少最明显,分别为-0.88%(近未来)和-1.13%(远未来)。最大增幅在近未来出现在2月(1.02%),远未来出现在1月(2.61%)。该情景下未来夏季温度的增加对光伏发电系统产生了负面影响。
(3)近地表短波辐射增加会促进PVP增加,而升温则对PVP产生负向影响,研究区内由风速变化引起的PVP变化较小。总体来看,近地表辐射对PVP变化的影响大于气温,是驱动PVP变化的主导原因。
本研究结果基于固定技术参数,未来光伏技术进步可能改变不同年份的系统鲁棒性。气候变化通过影响气象要素对可再生能源的发电性能产生重要影响,而提升可再生能源发电亦能显著降低温室气体排放,进而减缓气候变化,两者存在相互耦合、相互作用关系。本研究结果表明,在低排放情景下,我国近海光伏发电潜力在远期呈现增长趋势且显著优于高排放情景,凸显了低碳转型对可再生能源系统的正向反馈机制。建议采用碳定价、可再生能源配额等政策引导,弱化对高碳路径的依赖。同时,近海光伏规模化开发需构建生态保护协同机制,严格规避生态敏感区域。积极探索“光伏-海洋牧场”多能互补的生态友好型开发模式,并基于生态系统承载力阈值建立海域空间多功能利用的统筹管理机制,以平衡可再生能源开发与近海生物多样性保护目标。通过制定强有力的减排政策和可再生能源发展策略,不仅能够有效促进近海光伏发电的规模化应用,还将对减少温室气体排放、改善区域生态环境产生积极影响。
参考文献
Greenhouse-gas emission targets for limiting global warming to 2 degrees C
[J].
Warming caused by cumulative carbon emissions towards the trillionth tonne
[J].
The proportionality of global warming to cumulative carbon emissions
[J].
中国近海太阳能资源特征分析及储量评估
[J].
DOI:10.19912/j.0254-0096.tynxb.2022-1293
[本文引用: 2]

利用ERA5再分析资料研究中国近海太阳能年际、季节、月尺度和不同海区的时空分布特征,评估太阳能资源丰富程度,并对太阳能资源总量进行估算。结果表明:多年平均海上太阳总辐射范围为4886~7611 MJ/m<sup>2</sup>,年均辐射为6429 MJ/m<sup>2</sup>;太阳辐射随春、夏、秋、冬季节的变化而逐渐减小,分别为1894、1827、1462、1287 MJ/m<sup>2</sup>,春季最大、冬季最小,春夏季基本持平;月均总辐射在春季5月份最大,为650 MJ/m<sup>2</sup>,在冬季12月份最小,为377 MJ/m<sup>2</sup>。从空间上来看,渤海、黄海、东海太阳总辐射相近,年均辐射分别为5625、5581、5622 MJ/m<sup>2</sup>,南海中西部和中东部年均辐射量最大,并呈现出向南北两端递减的趋势,年均辐射为6843 MJ/m<sup>2</sup>,较渤、黄、东3个海区辐射平均值高出22%。经估算,中国近海太阳能资源年总量约为14×10<sup>9</sup> GWh,水深H<10、30、50 m的海域太阳能资源年总量分别约为600×10<sup>6</sup>、1700×10<sup>6</sup>、2800×10<sup>6</sup> GWh,总体来说海上太阳能资源很丰富,具有巨大的开发利用价值。
Characteristics analysis and reserve evaluation of offshore solar energy resources in China
[J].
DOI:10.19912/j.0254-0096.tynxb.2022-1293
[本文引用: 2]
Based on the ERA5 reanalysis dataset, the temporal and spatial variability characteristics of Chinese offshore solar energy (OSE) resources are analyzed at annual, seasonal and monthly scales in different sea areas. The richness level and the reserve of the OSE resources are evaluated. The results show that the annual offshore global horizontal radiation (GHR) is in the range of 4886-7611 MJ/m<sup>2</sup>, and the annual mean value is 6429 MJ/m<sup>2</sup>. The seasonal GHR has a decreasing trend from spring to winter with the corresponding values, 1894, 1827, 1462, 1287 MJ/m<sup>2</sup>. GHR has a maximum in spring, with little difference to summer, and it has a minimum in winter. On a monthly scale, the maximum of GHR of 650 MJ/m<sup>2</sup> occurs in May and the minimum of 377 MJ/m<sup>2</sup> in December. In terms of spatial distribution, the GHR in the Bohai Sea, the Yellow Sea and the East Sea have similar values of 5625, 5581 and 5622 MJ/m<sup>2</sup>, respectively. The South Sea's annual GHR of 6843 MJ/m<sup>2</sup> is the highest of the four, 22% higher than the average GHR of the other three. In the South Sea, the maximum occurs in the mid-east part and mid-west part, with a downward trend towards the north and south part. The annual OSE resources reserve is estimated at 14×10<sup>9</sup> GWh. It's 600×10<sup>6</sup>, 1700×10<sup>6</sup>, 2800×10<sup>6</sup> GWh for those sea areas when their water depth is less than 10, 30, 50 m, respectively. As a whole, OSE is abundant in the China Sea and has great value to develop and exploit.
Global reduction of solar power generation efficiency due to aerosols and panel soiling
[J].DOI:10.1038/s41893-020-0471-3 [本文引用: 1]
Impact of climate change on solar irradiation and variability over the Iberian Peninsula using regional climate models
[J].
Power-generation system vulnerability and adaptation to changes in climate and water resources
[J].
Climate change impacts on the energy system: a review of trends and gaps
[J].
Projections of long-term changes in solar radiation based on CMIP5 climate models and their influence on energy yields of photovoltaic systems
[J].
The impact of climate change on photovoltaic power generation in Europe
[J].
Dust and soiling issues and impacts relating to solar energy systems: literature review update for 2012-2015
[J].
Future evolution of surface solar radiation and photovoltaic potential in Europe: investigating the role of aerosols
[J].
Climate change impacts on wind energy potential in the European domain with a focus on the Black Sea
[J].DOI:10.1016/j.rser.2017.05.253 URL [本文引用: 1]
Southward shift of the global wind energy resource under high carbon dioxide emissions
[J].
Projections of future changes in solar radiation in China based on CMIP5 climate models
[J].
SSP“双碳”路径下赣江流域径流变化趋势
[J].
Runoff variation trend of Ganjiang River basin under SSP “Double Carbon” path
[J].
The Scenario Model Intercomparison Project (ScenarioMIP) for CMIP 6
[J].
DOI:10.5194/gmd-9-3461-2016
URL
[本文引用: 2]
. Projections of future climate change play a fundamental role in improving understanding of the climate system as well as characterizing societal risks and response options. The Scenario Model Intercomparison Project (ScenarioMIP) is the primary activity within Phase 6 of the Coupled Model Intercomparison Project (CMIP6) that will provide multi-model climate projections based on alternative scenarios of future emissions and land use changes produced with integrated assessment models. In this paper, we describe ScenarioMIP's objectives, experimental design, and its relation to other activities within CMIP6. The ScenarioMIP design is one component of a larger scenario process that aims to facilitate a wide range of integrated studies across the climate science, integrated assessment modeling, and impacts, adaptation, and vulnerability communities, and will form an important part of the evidence base in the forthcoming Intergovernmental Panel on Climate Change (IPCC) assessments. At the same time, it will provide the basis for investigating a number of targeted science and policy questions that are especially relevant to scenario-based analysis, including the role of specific forcings such as land use and aerosols, the effect of a peak and decline in forcing, the consequences of scenarios that limit warming to below 2 °C, the relative contributions to uncertainty from scenarios, climate models, and internal variability, and long-term climate system outcomes beyond the 21st century. To serve this wide range of scientific communities and address these questions, a design has been identified consisting of eight alternative 21st century scenarios plus one large initial condition ensemble and a set of long-term extensions, divided into two tiers defined by relative priority. Some of these scenarios will also provide a basis for variants planned to be run in other CMIP6-Endorsed MIPs to investigate questions related to specific forcings. Harmonized, spatially explicit emissions and land use scenarios generated with integrated assessment models will be provided to participating climate modeling groups by late 2016, with the climate model simulations run within the 2017–2018 time frame, and output from the climate model projections made available and analyses performed over the 2018–2020 period.
Global emissions pathways under different socioeconomic scenarios for use in CMIP6: a dataset of harmonized emissions trajectories through the end of the century
[J].
DOI:10.5194/gmd-12-1443-2019
URL
. We present a suite of nine scenarios of future emissions trajectories of\nanthropogenic sources, a key deliverable of the ScenarioMIP experiment within\nCMIP6. Integrated assessment model results for 14 different emissions species\nand 13 emissions sectors are provided for each scenario with consistent\ntransitions from the historical data used in CMIP6 to future trajectories using\nautomated harmonization before being downscaled to provide higher emissions\nsource spatial detail. We find that the scenarios span a wide range of\nend-of-century radiative forcing values, thus making this set of scenarios ideal\nfor exploring a variety of warming pathways. The set of scenarios is bounded on\nthe low end by a 1.9 W m−2 scenario, ideal for analyzing a world with\nend-of-century temperatures well below 2 ∘C, and on the high end by a 8.5 W m−2\nscenario, resulting in an increase in warming of nearly 5 ∘C over pre-industrial\nlevels. Between these two extremes, scenarios are provided such that differences\nbetween forcing outcomes provide statistically significant regional temperature\noutcomes to maximize their usefulness for downstream experiments within CMIP6.\nA wide range of scenario data products are provided for the CMIP6 scientific\ncommunity including global, regional, and gridded emissions datasets.
Climate model projections from the Scenario Model Intercomparison Project (ScenarioMIP) of CMIP 6
[J].
DOI:10.5194/esd-12-253-2021
URL
[本文引用: 1]
. The Scenario Model Intercomparison Project (ScenarioMIP) defines and coordinates the main set of future climate projections, based on concentration-driven simulations, within the Coupled Model Intercomparison Project phase 6 (CMIP6). This paper presents a range of its outcomes by synthesizing results from the participating global coupled Earth system models. We limit our scope to the analysis of strictly geophysical outcomes: mainly global averages and spatial patterns of change for surface air temperature and precipitation. We also compare CMIP6 projections to CMIP5 results, especially for those scenarios that were designed to provide continuity across the CMIP phases, at the same time highlighting important differences in forcing composition, as well as in results. The range of future temperature and precipitation changes by the end of the century (2081–2100) encompassing the Tier 1 experiments based on the Shared Socioeconomic Pathway (SSP) scenarios (SSP1-2.6, SSP2-4.5, SSP3-7.0 and SSP5-8.5) and SSP1-1.9 spans a larger range of outcomes compared to CMIP5, due to higher warming (by close to 1.5 ∘C) reached at the upper end of the 5 %–95 % envelope of the highest scenario (SSP5-8.5). This is due to both the wider range of radiative forcing that the new scenarios cover and the higher climate sensitivities in some of the new models compared to their CMIP5 predecessors. Spatial patterns of change for temperature and precipitation averaged over models and scenarios have familiar features, and an analysis of their variations confirms model structural differences to be the dominant source of uncertainty. Models also differ with respect to the size and evolution of internal variability as measured by individual models' initial condition ensemble spreads, according to a set of initial condition ensemble simulations available under SSP3-7.0. These experiments suggest a tendency for internal variability to decrease along the course of the century in this scenario, a result that will benefit from further analysis over a larger set of models. Benefits of mitigation, all else being equal in terms of societal drivers, appear clearly when comparing scenarios developed under the same SSP but to which different degrees of mitigation have been applied. It is also found that a mild overshoot in temperature of a few decades around mid-century, as represented in SSP5-3.4OS, does not affect the end outcome of temperature and precipitation changes by 2100, which return to the same levels as those reached by the gradually increasing SSP4-3.4 (not erasing the possibility, however, that other aspects of the system may not be as easily reversible). Central estimates of the time at which the ensemble means of the different scenarios reach a given warming level might be biased by the inclusion of models that have shown faster warming in the historical period than the observed. Those estimates show all scenarios reaching 1.5 ∘C of warming compared to the 1850–1900 baseline in the second half of the current decade, with the time span between slow and fast warming covering between 20 and 27 years from present. The warming level of 2 ∘C of warming is reached as early as 2039 by the ensemble mean under SSP5-8.5 but as late as the mid-2060s under SSP1-2.6. The highest warming level considered (5 ∘C) is reached by the ensemble mean only under SSP5-8.5 and not until the mid-2090s.
Fossil-fueled development (SSP5): an energy and resource intensive scenario for the 21st century
[J].
Modeling the photovoltaic potential of a site
[J].DOI:10.1016/j.renene.2009.11.010 URL [本文引用: 1]
A detailed modeling method for photovoltaic cells
[J].DOI:10.1016/j.energy.2006.12.006 URL [本文引用: 1]
Statistical and dynamical downscaling of the Seine basin climate for hydro-meteorological studies
[J].DOI:10.1002/joc.v27:12 URL [本文引用: 1]
基于CMIP6的2015—2100年中国气象干旱指数高分辨率数据集
[J/OL].
A dataset of high-resolution meteorological drought indices under the CMIP6 framework in China (2015-2100)
[J/OL].
共享社会经济路径(SSPs)下未来30年长江流域夏季降水预估
[J].
Projection of summer rainfall in the Yangtze River basin in the next 30 years under different shared socioeconomic pathways
[J].
The climate change perspective of photovoltaic power potential in Brazil
[J].
