

引言
在全球变暖背景下,极端气候事件的发生频率和强度呈现显著的上升趋势[1]。高温热浪、干旱等极端气候事件已成为全球关注的焦点,极端事件频发会对生态系统的结构和功能产生严重影响[2]。受气候变暖影响,高温热浪和极端干旱更易同时或相继发生,形成复合高温干旱事件。如2022年夏季,中国大部分地区出现了持续时间长且极端性强的高温过程,同时长江中下游流域大部分地区伴随严重的气象和水文干旱[3]。高温和干旱共同作用不仅会造成植被健康受损[4],还会带来森林野火[5]、虫害多发[6],引发一系列威胁整个生态系统稳定的连锁反应[7]。近40年来,中国复合高温干旱事件发生频率和强度显著增加[8],深入理解高温和干旱同时发生的复合极端事件对生态系统和植被的影响方式和机制,既能为生态保护等领域制定有效的气候变化应对措施提供科学基础,也对提升极端事件适应能力、减少经济损失起到积极作用[9-10]。
气候变暖背景下极端事件频发,显著改变植被结构和功能[11]。以往研究指出,极端高温和干旱同时发生比二者分别发生造成的影响更严重[12]。Ciais等[13]结合涡度相关通量站点观测和生态系统模型(ORCHIDEE)模拟发现,2003年的干旱和热浪同时发生造成整个欧洲大陆总初级生产力(GPP)下降了30%,为欧洲自20世纪以来的最大降幅。这可能是因为高温会提高大气饱和水汽压差,大气蒸发需求增大,加速地表蒸散,加剧了降水不足造成的土壤水分亏缺,对植物生理活性产生不利影响,同时植物面临水分胁迫时叶片气孔关闭限制了CO2吸收,以上过程都会抑制光合产物累积[4,14-15]。Shukla等[16]利用水文模型对加利福利亚地区2014年极端干旱进行了模拟分析,强调了温度在影响干旱严重程度中的关键作用,指出复合高温干旱事件中,高温加速了土壤水分蒸发,土壤湿度下降导致地表蒸发(潜热)减少,更多能量以感热形式释放,加剧地表升温。Gu等[17]利用多尺度指标体系融合机器学习模型、基于1950—2022年的全球再分析数据进行分析并指出,与独立发生骤旱相比,伴随极端高温的骤旱严重程度更高、持续时间更长。在气候变暖背景下,全球范围内极端高温和干旱事件同时或相继发生的频率持续增加,或将对植被造成更严重的负面影响[18]。但目前的机制研究多是针对高温或干旱事件分别开展,对复合极端高温干旱事件的影响程度和背后机制的研究仍相对有限。
青藏高原地区因其海拔较高的特殊地理条件,在全球气候变暖背景下展现出极为独特的气候敏感性,被称为区域和全球气候变化的“放大器”[19]。已有研究表明,青藏高原响应变暖速度是全球同期增温速率的两倍,快速变暖又可能导致冰川融化、冻土消融和湖泊扩张[20-21]。与此同时,区域植被系统表现出显著的生态脆弱性。Klein等[22]的控制实验发现,青藏高原的植被耐热阈值较低,气候变暖可能导致高海拔生态系统中植物物种多样性在短时间内急剧下降。因此,研究复合极端事件对青藏高原地区植被的影响,有助于揭示气候变化对区域生态系统的潜在威胁。2022年,青藏高原经历了21世纪以来最热且降水最少的一个夏季,形成了典型的极端高温与干旱同时发生的复合事件[23]。然而,现有研究主要针对复合高温干旱事件的发生机理[23],尚缺乏对此次复合高温干旱事件对植被生长的影响过程和机制的全面评估。此外,气候干湿背景和植被类型也会影响区域植被响应极端事件的方式[24-25],与森林和灌丛相比,青藏高原草本植被可能对外界环境胁迫更敏感[26]。此次复合高温干旱事件对青藏高原内不同区域和植被类型的影响差异有待研究。
鉴于此,本研究基于2000—2022年卫星遥感的归一化植被指数(NDVI)和再分析格点气候数据,分析了2022年夏季复合高温干旱事件下青藏高原植被NDVI的动态变化特征及时空规律,进一步探讨背后可能的驱动机制,为青藏高原地区的生态保护和气候变化应对提供科学依据。
1 数据与方法
1.1 研究区概况
青藏高原位于73°~106°E,26°~41°N之间,以高原山地气候为主,海拔高、空气干燥、日照时数长且太阳辐射强[27];降水具有空间异质性,整体自东南向西北递减,且主要集中在夏季[28]。青藏高原整体气温较周围区域更低,年际温差小但日温差大,受纬度和海拔影响,气温同样具有空间异质性[29]。青藏高原高程及植被分布如图1所示,植被类型以草地为主,包括草甸、草原、森林、灌丛等多种植被类型。本研究所用的青藏高原边界、高程数据和植被区划数据分别来源于中国科学院资源环境与科学数据中心①(①
图1
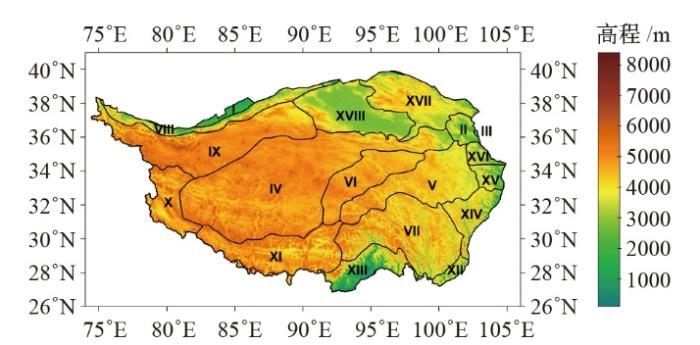
图1
青藏高原高程及植被类型分布图
注:I代表暖温带灌木、半灌木、裸露;II代表温带南部森林(草甸)草原;III代表温带南部荒漠草原;IV代表高寒草原;V代表高寒灌丛,草甸;VI代表高寒草甸;VII代表亚热带山地寒温性针叶林;VIII代表暖温带灌木、半灌木荒漠;IX代表高寒荒漠;X代表温性荒漠;XI代表温性草原;XII代表中亚热带常绿阔叶林;XIII代表北热带季节雨林、半常绿季雨林;XIV代表中亚热带常绿阔叶林;XV代表北热带半常绿季雨林、湿润雨林;XVI代表暖温带南部落叶栎林;XVII代表温带灌木、半灌木荒漠;XVIII代表温带半灌木,灌木荒漠。
Fig. 1
Elevation and vegetation type distribution map of the Tibetan Plateau
1.2 数据来源及预处理
气候数据资料来源于2000—2022年中国地面气象台站观测的格点化逐日CN05.1数据集[30],空间分辨率为0.25°×0.25°,选用日最高气温和日降水数据来计算研究区的气候状况。植物生长的最适温度数据来自于Huang等[31],空间分辨率为1 km×1 km。土壤水分数据来源于ERA5-Land的再分析数据②(②
植被的生长状况研究常借助于遥感的植被指数数据,NDVI是最常用的植被指数之一,能很好地反映植被的生长状况,较其他植被指数更敏感,适用于监测植被生长状况和变化异常[32-33]。NDVI数据来源于2000—2022年每16 d的MODIS MOD13C1 V061产品数据集③(③
在预处理时,基于NDVI数据像元可靠性图层进行质量控制,逐景剔除NDVI图层中无数据、冰/雪覆盖和云覆盖的像元,同时剔除NDVI<0.1(视为无植被覆盖)的像元。最终研究区域定义为2000—2022年间青藏高原内有效数据比例不低于75%的像元。GPP数据同样进行质量控制并剔除GPP<0的像元,将2001—2022年间青藏高原内有效数据比例不低于75%的像元作为GPP补充分析的研究区域。
为匹配CN05.1数据空间分辨率,研究中将所有格点数据空间分辨率统一利用双线性插值法重采样为0.25°×0.25°,确保区域分析的一致性。植被生长季定义为每年5—9月。在此基础上,计算了生长季平均日最高气温、生长季累积降水量和生长季平均NDVI。
1.3 极端事件检测识别
基于2000—2021年的气候标准态,逐一像元计算了2000—2022年生长季(5—9月)的平均日最高气温和生长季累积降水量的标准化距平。在此基础上,当生长季平均日最高气温的标准化距平超过1.5时,定义为极端高温。当生长季累积降水量的标准化距平低于-1.5时,定义为极端干旱。对同一地区的同一像元,当极端高温和极端干旱同时被检测到时,则定义为发生了复合极端高温干旱事件[34]。
1.4 统计分析
1.4.1 主成分分析(PCA)
主成分分析(PCA)是一种多元统计方法,通过降维的方法,能够将初始相关的数据集转换为一个新的不相关的数据集,新数据集由原始数据线性组合得到,使得大部分信息集中在前几个变量当中[35]。本研究中采用相关主成分分析对NDVI进行分解。首先,对于2000—2022年生长季平均NDVI数据,以2000—2021年作为气候态计算均值和标准差,得到2000—2022年生长季平均NDVI的标准化距平值。其次,将得到的标准化距平值降维进行经验正交函数分析,对数据重建,采用Jolliffe截断准则[36],保留方差解释度>总方差×a/M的所有主成分。本研究中a=0.7,基于Jolliffe准则的经验解释方差阈值得到;M=23,为总主成分数量,总方差为1。基于该准则,保留方差解释度超过0.7/23×100%=3.04%的主成分,截断到第6主成分。NDVI-PC1由第一主成分重建得到,NDVI-IAV为第2~6主成分累加重建的结果,分别代表NDVI生长季平均的长期变化情况和年际波动情况。
1.4.2 趋势分析
1.4.3 偏相关分析
偏相关分析为在剔除协变量的影响下,探究某两个变量之间相关性的一种分析方法,能够有效反映两个变量之间的直接相关性[41]。对2000—2022年去趋势的生长季累积降水量、生长季平均日最高气温与去趋势的生长季NDVI进行偏相关分析,这里长期趋势采用Theil-Sen方法得到。
2 结果与讨论
2.1 复合极端高温干旱事件下的高原植被生长状况
2022年生长季(5—9月)期间,青藏高原研究区域内平均日最高气温达2000年以来的历史同期最高值,研究区域生长季累积降水量也表现出低于-1.5倍标准差的负异常(图2),表明该区域在生长季期间经历了一次复合高温干旱事件。这与周佰铨等[23]发现的青藏高原2022年夏季(6—8月)复合高温干旱事件的结论一致。2000—2022年,在气候变暖的背景下,青藏高原植被整体呈现“绿化”趋势(图3a),研究区生长季平均NDVI标准化距平以每年0.14的速率增加,这种植被整体向好趋势与Anniwaer等[42]的研究结论一致。但在2022年生长季期间极端高温干旱的影响下,当年区域平均NDVI与前一年相比下降了约28%。从空间上(图3b)来看,约16%的研究区域当年生长季平均NDVI表现出负距平,如青藏高原西南部大部、中部和东北部部分地区;其中低于-2倍标准差的负距平占研究区域的1%。
图2
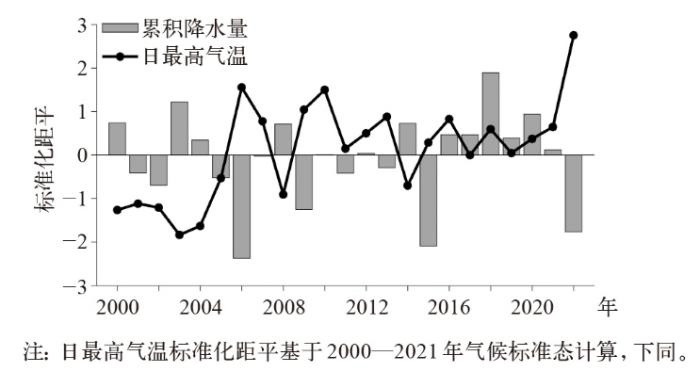
图2
2000—2022年青藏高原生长季平均日最高气温和累积降水量的标准化距平
注:日最高气温标准化距平基于2000—2021年气候标准态计算,下同。
Fig. 2
Standardized anomalies of growing-season averaged daily maximum temperature and cumulative precipitation over the Tibetan Plateau from 2000 to 2022
图3
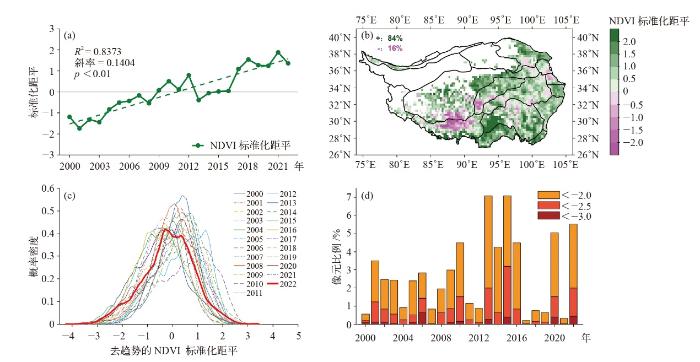
图3
青藏高原植被生长状况(a) 2000—2022年青藏高原区域生长季平均NDVI的标准化距平,(b) 2022年生长季平均NDVI标准化距平值的空间分布,(c) 2000—2022年去趋势后的生长季平均NDVI标准化距平的概率密度函数,(d) 2000—2022年去趋势后的生长季平均NDVI标准化距平低于-2.0、-2.5和-3.0的像元占比
Fig. 3
Vegetation growth status on the Tibetan Plateau. (a) Standardized anomaly of growing-season averaged NDVI over the Tibetan Plateau from 2000 to 2022, (b) spatial distribution of standardized anomaly of growing-season averaged NDVI in 2022, (c) probability density function of detrended standardized anomaly of growing-season averaged NDVI from 2000 to 2022, (d) pixel proportion of detrended standardized anomaly of growing season average NDVI below -2.0, -2.5 and -3.0 from 2000 to 2022
2.2 青藏高原生长季NDVI主成分分析结果
对生长季NDVI标准化距平进行PCA分解,得到的前6个主成分所占的方差贡献分别为38.6%、10.1%、9.8%、5.0%、4.3%和3.5%,共解释了71.3%的方差。图4(a)中,NDVI-PC1为第一主成分重建数据,反映了青藏高原生长季NDVI整体的绿化趋势;NDVI-IAV为第2~6主成分重建的时间序列,反映了NDVI的年际变异情况。由2022年的NDVI-PC1(图4b)和NDVI-IAV(图4c)空间分布可知,2022年NDVI-PC1在98%的区域表现出正距平,这一空间特征反映了CO2施肥效应、气候变暖及生长季延长共同驱动下的青藏高原长期“绿化”趋势[43-44];NDVI-IAV的空间分布解释了2022年生长季NDVI的大部分异常情况,代表在当年的气候异常影响下植被的不同响应。NDVI-IAV的正距平集中在青藏高原南部和中西部,负距平集中在西南部、中南部和东北部。利用MODIS GPP的分析结果也得到了相似的空间格局,2022年GPP-IAV负距平主要分布在青藏高原西南部、中部和东北部(图5a)。本研究所揭示的青藏高原生长季NDVI负距平分布与周佰铨等[23]发现的高温干旱复合事件区域一致性较好,都集中分布在青藏高原的中南部和东部地区。由于不同区域的气候背景和植被类型存在差异,植被敏感性也不同,所以NDVI-IAV呈现明显的空间异质性。
图4
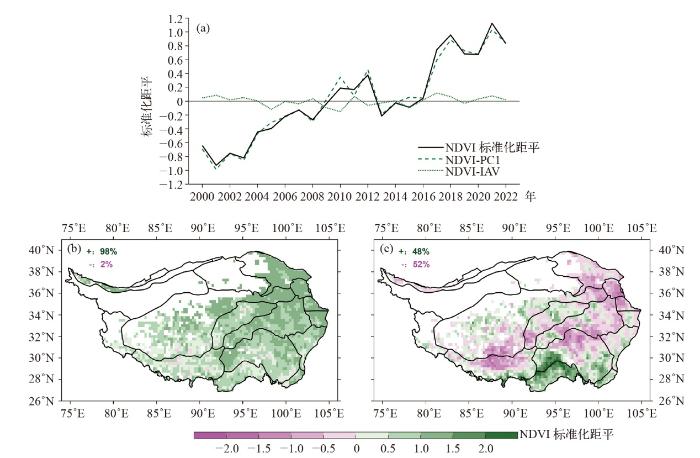
图4
青藏高原生长季NDVI标准化距平的主成分分析结果(a) 2000—2022年青藏高原NDVI标准化距平的区域平均、第1主成分重建的NDVI-PC1及第2~6主成分重建的NDVI-IAV时间序列,(b) 2022年NDVI-PC1空间分布,(c) 2022年NDVI-IAV空间分布
Fig. 4
Principal component analysis results of NDVI standardization anomaly during the growing season in the Tibetan Plateau. (a) Time series of regional average standardized anomaly of NDVI, NDVI-PC1 reconstructed by the first principal component, and NDVI-IAV reconstructed by the 2nd to 6th principal components over the Tibetan Plateau from 2000 to 2022, (b) spatial distribution of NDVI-PC1 in 2022, (c) spatial distribution of NDVI-IAV in 2022
图5
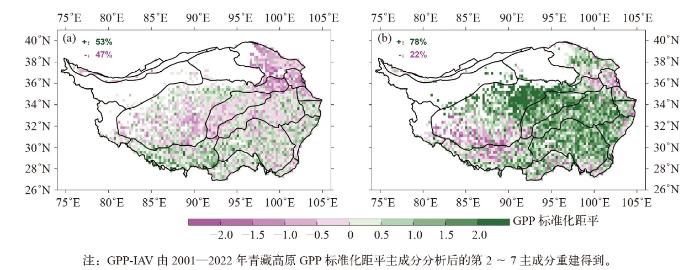
图5
青藏高原GPP变化情况(a) 2022年青藏高原GPP-IAV空间分布,(b) 2022年青藏高原7—8月GPP标准化距平的空间分布
注:GPP-IAV由2001—2022年青藏高原GPP标准化距平主成分分析后的第2~7主成分重建得到。
Fig. 5
Ecosystem GPP over the Tibetan Plateau. (a) Spatial distribution of GPP-IAV on the Tibetan Plateau in 2022 (with GPP-IAV reconstructed from the 2nd to 7th principal components of the standardized anomaly of GPP on the Tibetan Plateau from 2001 to 2022),(b) spatial distribution of standardized anomaly of GPP on the Tibetan Plateau in July-August, 2022
2.3 植被变化与温度和降水的关系
为进一步明晰2022年复合极端高温干旱事件对NDVI变化的影响机制,分别对2000—2022年生长季累积降水量、平均日最高气温与NDVI进行去趋势后的偏相关分析(图6)。研究区域内64%的像元呈现最高气温与NDVI之间的正相关关系,显著正相关的区域(p<0.05)占研究区域总像元的10%,负相关主要出现在青藏高原西南部、中南部和东北部。累积降水和NDVI在研究区域内77%的像元呈正相关,其中显著正相关(p<0.05)的区域占研究区域总像元的21%。负相关的区域主要在东南部部分地区,这些区域植被类型多为森林(图1),本身水分条件较为充足,过量降水可能导致土壤水分过饱和,影响根系呼吸,降低植物的生长活力[45];同时对于森林覆盖区域来说,频繁降雨可能伴随浓密的云层,减少光照,抑制光合作用,进而导致NDVI下降[46]。
图6
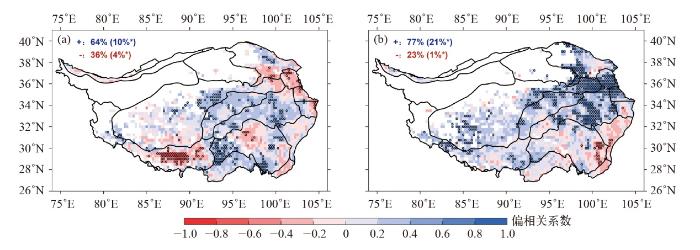
图6
2000—2022年去趋势的青藏高原地区生长季平均NDVI与平均日最高气温(a)和累积降水量(b)的偏相关系数的空间分布
注:图中空心圆标注像元代表通过了显著性检验(p<0.05)。括号中*代表通过0.05显著性检验,数字代表通过显著性检验的像元占比。
Fig. 6
Spatial distribution of partial correlation coefficients between detrended growing season NDVI and mean daily maximum temperature (a) and cumulative precipitation (b) on the Tibetan Plateau from 2000 to 2022
结合NDVI变化和NDVI与气温、降水的偏相关系数,图7为2022年复合高温干旱造成的青藏高原植被生长状况的空间分布特征。可以发现,2022年青藏高原复合极端高温干旱事件对植被产生显著负面影响的区域主要为NDVI与气温呈负相关且与降水呈正相关的区域,即青藏高原西南部和东北部部分地区,主要植被类型为高寒草原、温性草原、森林(草甸)草原和灌木荒漠。这些植被类型对水分条件的依赖性较强,在水分充足的条件下能够更好地生长,降水的增加会显著提高植被的覆盖度和生产力[47]。然而,即便是同一植被类型,不同区域下受到复合高温干旱事件的影响也不尽相同,结合青藏高原干湿分区,发现受显著负面影响的区域多为半干旱区[48]。降水为这些地区影响植被生长的主要限制因子,土壤水分不足的情况下,升温会导致蒸发量增加,从而抑制植物生长[49-50]。另外,高原南部NDVI与最高气温呈显著负相关的区域集中在高海拔区域,且植被类型均为海拔4000 m以上的草原,这主要是因为高海拔草原对气温变化的敏感性随海拔高度的增加而增加[51]。因此,青藏高原西南部和东北部部分地区的植被NDVI与气温呈负相关且与降水呈正相关,在遭遇复合高温干旱事件时受到的抑制作用最显著。
图7
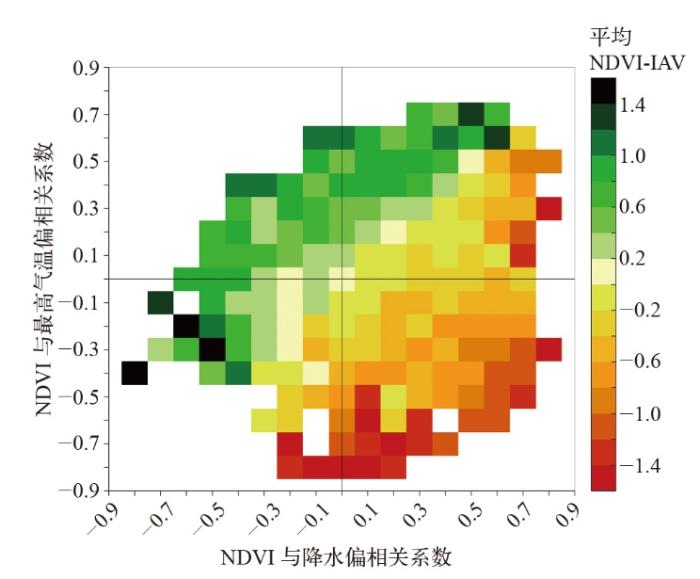
图7
2022年复合高温干旱事件造成青藏高原植被变化的空间分布特征
注:填色像元代表对应相关系数下2022年青藏高原地区经PCA处理得到的NDVI-IAV的平均值。
Fig. 7
The spatial distribution characteristics of vegetation change in the Tibetan Plateau caused by the compound hot-dry extreme event in 2022
2.4 生长季内水热条件变化和植被生长情况
为剖析2022年青藏高原气候异常影响下植被生长的动态过程及其与气候要素的关系,图8(a)为2022年青藏高原生长季内区域平均NDVI的变化情况。可以发现,2022年生长季初期(5—6月)植被迅速生长,NDVI绝对值高于其他所有年份,7月中旬达峰值,达峰时间较绝大多数年份更加提前,之后NDVI开始下降,7—8月NDVI较往年偏低。图8(b)为2022年7—8月NDVI变化的空间分布情况,低于-1.5倍标准差的负异常主要分布在青藏高原中南部、西南部及东北部部分地区。当年7—8月,GPP显著降低也同样主要分布于青藏高原西南部和东北部部分地区(图5b),GPP和NDVI的结果在西南和东北部的植被显著受抑制的区域呈现出类似格局,但NDVI负异常在中南部另有显著分布,GPP反映的植被受抑制空间范围相对更小。
图8
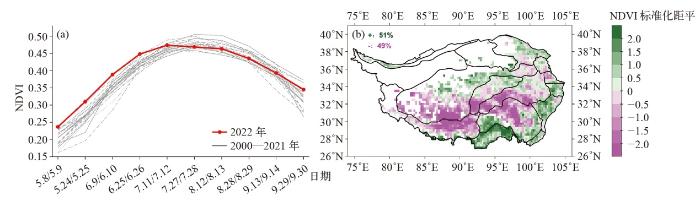
图8
青藏高原生长季内NDVI变化情况(a) 2000—2022年生长季区域平均NDVI变化,(b) 2022年研究区域7—8月平均NDVI标准化距平值的空间分布
Fig. 8
Changes in NDVI during the growing season in the Tibetan Plateau. (a) Interannual variability of regionally averaged NDVI, (b) spatial distribution of standardized anomaly of NDVI in July-August, 2022
图9
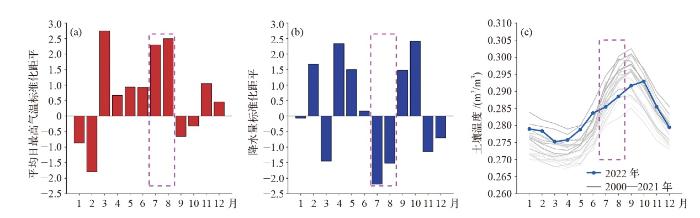
图9
2022年青藏高原研究区域日最高气温(a)、累积降水(b)和0~289 cm深度平均土壤湿度(c)的逐月变化情况
Fig. 9
Monthly variations of daily maximum temperature (a), cumulative precipitation (b), and soil moisture averaged over 0-289 cm depth (c) on the Tibetan Plateau in 2022
图10
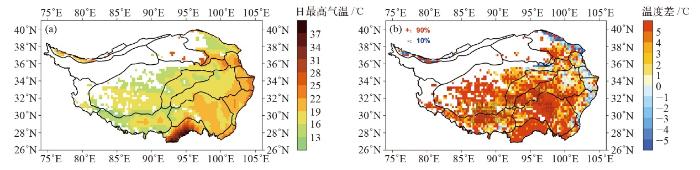
图10
2022年青藏高原7—8月日最高气温(a)及其与植被生长最适温度的差值(b)的空间分布
注:(b)图空心矩形标注像元代表7—8月平均NDVI标准化距平值低于-1.5的区域。植被光合最适温度数据因其分辨率过高且青藏高原缺值较多,重采样单独采用最近邻插值方法以保留较多原始数据。
Fig. 10
Spatial distribution of daily maximum temperature (a) and the difference between daily maximum temperature and the optimal temperature for vegetation growth (b) on the Tibetan Plateau during July-August, 2022
2.5 不足与展望
本研究围绕2022年青藏高原复合极端高温干旱事件对区域植被影响及生态响应机制展开研究,研究过程中存在以下不足。首先,本研究发现受2022年复合极端高温干旱事件影响,研究区域生长季平均NDVI标准化距平低于-2的区域占比位居研究时段内第三位,仅次于2013和2015年(图3d)。但从气候异常情况来看,2013年仅出现夏季极端高温[23],2015年仅出现生长季极端干旱(图2),但这两年植被生长受严重抑制的区域占比却超过2022年,造成这一现象的具体原因需在未来研究中进行更具体的分析。另外,研究中用到的气候和遥感数据空间分辨率较粗,为0.25°×0.25°,可能忽略了青藏高原复杂地形、植被群落内部组成和结构差异等影响因素,限制了对局地植被响应的准确捕捉,后续研究需进一步结合站点观测和控制试验结果,加强针对复合高温干旱事件对植被影响的机制分析。
3 结论
本研究系统评估了2022年青藏高原复合极端高温干旱事件造成的区域植被变化,并揭示了影响机制,主要结论如下。
2022年复合极端高温干旱事件显著抑制了当年青藏高原植被生长,区域平均生长季的NDVI较前一年同期下降28%,严重受抑制区域主要集中在青藏高原西南部、中南部和东北部部分地区,主要植被类型为相对干旱的温性草原、高寒草原、森林(草甸)草原和灌木荒漠。对于这些区域,在降水偏少、土壤水分不足的情况下,升温会导致蒸发量增加,从而加剧水分胁迫、抑制植物生长。
2022年青藏高原春季偏暖,利于春季物候提前,加快土壤水分消耗;而当年夏季降水偏少,不足以补充蒸腾失水,造成夏季土壤严重干旱。这继而改变了夏季地表能量平衡,通过陆气反馈加剧地表气温升高,在青藏高原90%以上地区同期日最高气温超过了植物光合作用的最适温度。这种复合的水分和温度胁迫共同抑制了青藏高原植被生长。
综上所述,尽管青藏高原生态系统在气候变暖背景下呈现“绿化”趋势,但极端气候事件对区域植被生长的负面影响十分显著,尤其在青藏高原内相对干旱地区。鉴于青藏高原的生态脆弱性及适应能力的不足,未来应加强极端气候事件与生态系统相互作用的研究,利用更完善的观测网络与更长序列的观测,进一步深化对复合高温干旱事件影响机制的认识,以便为区域防灾减灾及气候变化应对提供科学支撑。
参考文献
The impacts of climate extremes on the terrestrial carbon cycle: a review
[J].
2022年夏季中国高温干旱气候特征及成因探讨
[J].
Discussion on the climatic characteristics and causes of high temperature and drought in summer 2022 in China
[J].
Impacts of record-breaking compound heatwave and drought events in 2022 China on vegetation growth
[J].
Assessing the role of compound drought and heatwave events on unprecedented 2020 wildfires in the Pantanal
[J].
Effects of drought and heat on forest insect populations in relation to the 2003 drought in western Europe
[J].DOI:10.1051/forest:2006044 URL [本文引用: 1]
Memory effects of vegetation after extreme weather events under various geological conditions in a typical karst watershed in southwestern China
[J].DOI:10.1016/j.agrformet.2023.109840 URL [本文引用: 1]
Amplified intensity and duration of heatwaves by concurrent droughts in China
[J].
Future climate risk from compound events
[J].DOI:10.1038/s41558-018-0156-3 [本文引用: 1]
Compound heat and moisture extreme impacts on global crop yields under climate change
[J].
植被物候对极端气候响应及机制
[J].
DOI:10.11821/dlxb202309008
[本文引用: 1]

人类活动引起的气候变化导致极端气候事件频发,改变植物的生理过程,影响陆地生态系统碳、水循环和能量平衡。植被物候是气候变化最敏感的生物学指示指标,近年来植被物候对气候变化的响应研究主要关注气候平均态,植被物候如何响应极端气候事件研究相对较少,响应机制仍不清楚。本文梳理了植被春季和秋季物候对各类极端气候事件的响应及其机制,发现北半球中高纬度地区,季前极端低温与极端降水直接导致植被返青期推迟、枯黄期提前,而极端高温和极端干旱导致植物气孔关闭,抑制光合和蒸腾作用,间接导致枯黄期提前。目前植被物候响应极端气候事件研究缺乏对复合极端气候事件的关注,而且植被物候对极端气候响应的滞后效应以及极端气候事件发生后植被的恢复过程研究较少。未来气候变化情景下,需构建考虑极端气候事件影响的植被物候模型,并与动态植被模型耦合,以提高陆地生态系统碳循环的模拟精度。
Vegetation phenology responses and mechanisms to extreme climate
[J].
Do successive climate extremes weaken the resistance of plant communities? An experimental study using plant assemblages [J]. Biogeosciences
Europe-wide reduction in primary productivity caused by the heat and drought in 2003
[J].DOI:10.1038/nature03972 [本文引用: 1]
Impacts of droughts and extreme temperature events on gross primary production and ecosystem respiration: a systematic assessment across ecosystems and climate zones
[J].
DOI:10.5194/bg-15-1293-2018
URL
[本文引用: 1]
. Extreme climatic events, such as droughts and heat stress, induce anomalies in ecosystem–atmosphere CO2 fluxes, such as gross primary production (GPP) and ecosystem respiration (Reco), and, hence, can change the net ecosystem carbon balance. However, despite our increasing understanding of the underlying mechanisms, the magnitudes of the impacts of different types of extremes on GPP and Reco within and between ecosystems remain poorly predicted. Here we aim to identify the major factors controlling the amplitude of extreme-event impacts on GPP, Reco, and the resulting net ecosystem production (NEP). We focus on the impacts of heat and drought and their combination. We identified hydrometeorological extreme events in consistently downscaled water availability and temperature measurements over a 30-year time period. We then used FLUXNET eddy covariance flux measurements to estimate the CO2 flux anomalies during these extreme events across dominant vegetation types and climate zones. Overall, our results indicate that short-term heat extremes increased respiration more strongly than they downregulated GPP, resulting in a moderate reduction in the ecosystem's carbon sink potential. In the absence of heat stress, droughts tended to have smaller and similarly dampening effects on both GPP and Reco and, hence, often resulted in neutral NEP responses. The combination of drought and heat typically led to a strong decrease in GPP, whereas heat and drought impacts on respiration partially offset each other. Taken together, compound heat and drought events led to the strongest C sink reduction compared to any single-factor extreme. A key insight of this paper, however, is that duration matters most: for heat stress during droughts, the magnitude of impacts systematically increased with duration, whereas under heat stress without drought, the response of Reco over time turned from an initial increase to a downregulation after about 2 weeks. This confirms earlier theories that not only the magnitude but also the duration of an extreme event determines its impact. Our study corroborates the results of several local site-level case studies but as a novelty generalizes these findings on the global scale. Specifically, we find that the different response functions of the two antipodal land–atmosphere fluxes GPP and Reco can also result in increasing NEP during certain extreme conditions. Apparently counterintuitive findings of this kind bear great potential for scrutinizing the mechanisms implemented in state-of-the-art terrestrial biosphere models and provide a benchmark for future model development and testing.
Warming accelerates global drought severity
[J].
DOI:10.1038/s41586-025-09047-2
[本文引用: 1]
Drought is one of the most common and complex natural hazards affecting the environment, economies and populations globally1–4. However, there are significant uncertainties in global drought trends4–6, and a limited understanding of the extent to which a key driver, atmospheric evaporative demand (AED), impacts the recent evolution of the magnitude, frequency, duration and areal extent of droughts. Here, by developing an ensemble of high-resolution global drought datasets for 1901–2022, we find an increasing trend in drought severity worldwide. Our findings suggest that AED has increased drought severity by an average of 40% globally. Not only are typically dry regions becoming drier but also wet areas are experiencing drying trends. During the past 5 years (2018–2022), the areas in drought have expanded by 74% on average compared with 1981–2017, with AED contributing to 58% of this increase. The year 2022 was record-breaking, with 30% of the global land area affected by moderate and extreme droughts, 42% of which was attributed to increased AED. Our findings indicate that AED has an increasingly important role in driving severe droughts and that this tendency will likely continue under future warming scenarios.
Temperature impacts on the water year 2014 drought in California
[J].DOI:10.1002/grl.v42.11 URL [本文引用: 1]
Flash drought impacts on global ecosystems amplified by extreme heat
[J].
Increased stress from compound drought and heat events on vegetation
[J].DOI:10.1016/j.scitotenv.2024.175113 URL [本文引用: 1]
Altitude and temperature dependence of change in the spring vegetation green-up date from 1982 to 2006 in the Qinghai-Xizang Plateau
[J].DOI:10.1016/j.agrformet.2011.06.016 URL [本文引用: 1]
Black soot and the survival of Tibetan glaciers
[J].
DOI:10.1073/pnas.0910444106
PMID:19996173
[本文引用: 1]
We find evidence that black soot aerosols deposited on Tibetan glaciers have been a significant contributing factor to observed rapid glacier retreat. Reduced black soot emissions, in addition to reduced greenhouse gases, may be required to avoid demise of Himalayan glaciers and retain the benefits of glaciers for seasonal fresh water supplies.
Recent Third Pole’s rapid warming accompanies cryospheric melt and water cycle intensification and interactions between monsoon and environment: multidisciplinary approach with observations, modeling, and analysis
[J].
DOI:10.1175/BAMS-D-17-0057.1
URL
[本文引用: 1]
The Third Pole (TP) is experiencing rapid warming and is currently in its warmest period in the past 2,000 years. This paper reviews the latest development in multidisciplinary TP research associated with this warming. The rapid warming facilitates intense and broad glacier melt over most of the TP, although some glaciers in the northwest are advancing. By heating the atmosphere and reducing snow/ice albedo, aerosols also contribute to the glaciers melting. Glacier melt is accompanied by lake expansion and intensification of the water cycle over the TP. Precipitation has increased over the eastern and northwestern TP. Meanwhile, the TP is greening and most regions are experiencing advancing phenological trends, although over the southwest there is a spring phenological delay mainly in response to the recent decline in spring precipitation. Atmospheric and terrestrial thermal and dynamical processes over the TP affect the Asian monsoon at different scales. Recent evidence indicates substantial roles that mesoscale convective systems play in the TP’s precipitation as well as an association between soil moisture anomalies in the TP and the Indian monsoon. Moreover, an increase in geohazard events has been associated with recent environmental changes, some of which have had catastrophic consequences caused by glacial lake outbursts and landslides. Active debris flows are growing in both frequency of occurrences and spatial scale. Meanwhile, new types of disasters, such as the twin ice avalanches in Ali in 2016, are now appearing in the region. Adaptation and mitigation measures should be taken to help societies’ preparation for future environmental challenges. Some key issues for future TP studies are also discussed.
Experimental warming causes large and rapid species loss, dampened by simulated grazing, on the Tibetan Plateau
[J].
2022年夏季青藏高原高温干旱复合事件的双变量归因
[J].
Bivariate attribution of the compound hot and dry summer of 2022 on the Tibetan Plateau
[J].DOI:10.1007/s11430-023-1320-y [本文引用: 5]
Impacts of multiple temporal and spatial scale drought on grassland vegetation dynamics in the Tibetan Plateau region of China, 1982-2015
[J].DOI:10.1016/j.envdev.2024.101033 URL [本文引用: 1]
Increasing compound drought and hot event over the Tibetan Plateau and its effects on soil water
[J].
青藏高原植被绿度变化及其对干湿变化的响应
[J].
DOI:10.17521/cjpe.2021.0500
[本文引用: 1]
青藏高原是全球气候变化的敏感区, 特殊的自然环境孕育了极端脆弱的植被及其生态系统, 已成为研究植被对气候变化响应的一个理想区域。植被易受气候变化的影响且响应可能因季节和植被类型而异。该研究将标准化降水蒸散指数(SPEI)和MODIS归一化植被指数(NDVI)分别作为干湿度和植被绿度指标, 采用Sen’s斜率估计、BFAST模型和相关分析, 分析了2000-2018年青藏高原植被绿度变化的时空格局特征, 并探讨了植被绿度对干湿变化的响应。结果表明: 2000-2018年青藏高原植被绿度呈上升趋势, 但变化速率空间差异显著。大部分高原地区植被绿度于2012-2015年间存在突变, 突变后普遍呈上升趋势, 以藏北地区最为突出。青藏高原植被生长季NDVI与不同时间尺度SPEI整体呈正相关关系, 且在生长季的中后期相关性逐渐增强。青藏高原植被对SPEI的响应表现出一定的年内周期性, 草本植被(草甸和草原)区尤为显著。相对于森林和灌丛植被, 草本植被对SPEI响应更为敏感, 且在生长季的不同阶段对不同时间尺度的SPEI的响应存在明显差异。
Vegetation greenness change and its response to dry-wet changes on the Tibetan Plateau
[J].DOI:10.17521/cjpe.2021.0500 URL [本文引用: 1]
基于 ITPCAS数据的青藏高原太阳总辐射时空变化特征
[J].
Spatio-temporal variation characteristics of total solar radiation on the Tibetan Plateau based on ITPCAS data
[J].
1978—2018年青藏高原降水区划及各区降水量时空演变特征
[J].
Precipitation zoning and spatio-temporal evolution characteristics in the Tibetan Plateau from 1978 to 2018
[J].
青藏高原地区近40年来气候变化的特征
[J].
Characteristics of climate change in the Tibetan Plateau over the past 40 years
[J].
一套格点化的中国区域逐日观测资料及与其它资料的对比
[J].
A gridded daily observational dataset for regional China and comparisons with other datasets
[J].
Air temperature optima of vegetation productivity across global biomes
[J].
Global trends analysis of the main vegetation types throughout the past four decades
[J].DOI:10.1016/j.apgeog.2018.05.020 URL [本文引用: 1]
2000—2021年泾河流域植被NDVI变化及影响因素
[J].
Changes of vegetation NDVI and influencing factors in the Jinghe River basin from 2000 to 2021
[J].
A typology of compound weather and climate events
[J].
Annual and interannual variability of NDVI in Brazil and its connections with climate
[J].DOI:10.1080/0143116021000053788 URL [本文引用: 1]
Principal component analysis
[J].
A rank-invariant method of linear and polynomial regression analysis
[J].
Estimates of the regression coefficient based on Kendall’s tau
[J].
Non-parametric test against trend
[J].DOI:10.2307/1907187 URL [本文引用: 1]
Rank correlation methods
[J].
基于偏相关分析的 2003—2020年青藏高原地表温度变化驱动因子量化研究
[J].
DOI:10.11947/j.AGCS.2024.20230206
[本文引用: 1]
地表温度(LST)作为地气相互作用的关键参数,在地表水热循环中发挥重要作用,能准确表征地表热环境的变化。青藏高原拥有除极地以外储量最大的冰冻圈范围,对区域和全球气候系统及生态经济具有深远影响。作为受气候变化影响最显著的区域之一,深入了解青藏高原冰冻圈LST变化驱动因子,能为精准认知青藏高原冰冻圈热环境变化规律及驱动机制提供关键科学支撑。本研究基于地表温度年周期模型提取的年均地表温度(MAST),采用偏相关分析,分析了2003—2020年MAST与云量、植被覆盖度、积雪覆盖率、降水和气温5个与MAST变化密切相关的驱动因子之间的关系,揭示青藏高原不同区域MAST变化的主要驱动因子及其空间分布特征。结果表明,白天云量、植被覆盖度、积雪覆盖率和降水这4个驱动因子主要以负偏相关为主,晚上则以正偏相关为主,对于气温来说昼夜都以正偏相关为主。就青藏高原MAST动态的主导因子来说,昼夜MAST在青藏高原不同区域的主导因素存在明显差异,白天青藏高原的MAST的变化主要受云量的影响(主导变化面积占比达38.17%),影响区域集中分布于青藏高原的西北部和西部,且以负偏相关性为主。夜晚青藏高原MAST变化主要以气温为主导(主导变化面积超过48%),且以正偏相关为主,反映出夜晚MAST受气候变暖的影响强于白天。本研究能为气候变化背景下青藏高原冰冻圈保护和可持续发展提供科学的参考。
Quantitative study on driving factors of surface temperature change on the Tibetan Plateau from 2003 to 2020 based on partial correlation analysis
[J].
Shifts in the trends of vegetation greenness and photosynthesis in different parts of Tibetan Plateau over the past two decades
[J].DOI:10.1016/j.agrformet.2023.109851 URL [本文引用: 1]
Spatial variations in carbon dioxide fertilization effect on vegetation greening across the Tibetan Plateau
[J].
Characteristics, drivers and feedbacks of global greening
[J].
降雨引起的干湿交替对土壤呼吸的影响: 进展与展望
[J].土壤呼吸是全球陆地生态系统碳循环重要组成部分,降雨作为扰动因子对土壤呼吸动态的改变将直接影响全球碳平衡。探讨降雨对土壤呼吸的作用机制是陆地生态系统碳循环和碳收支研究的重要内容。本文综述了近年来国内外学者关于降雨引起的干湿交替对土壤呼吸影响机制的研究进展,阐述了土壤水分对土壤呼吸的影响及其机理。土壤水分在适宜范围内促进土壤呼吸,过高或过低均抑制土壤呼吸;降雨引起的干湿交替通过改变土壤水分影响土壤呼吸。一方面,干旱条件下,降雨引起的干湿交替主要通过短时间置换土壤中CO<sub>2</sub>、增加土壤微生物呼吸底物、提高微生物活性、增强凋落物分解速率等途径提高土壤呼吸速率。另一方面,湿度较高的土壤经过短时间降雨迅速达到水分饱和或积水状态,降雨引发的干湿交替通过限制O<sub>2</sub>进入土壤,形成厌氧环境,抑制微生物和根系呼吸。此外,降雨引发的干湿交替还通过地表积水淹没部分植株,降低植物叶面积,减少光合产物,显著抑制根系呼吸。为更准确估算降雨变化影响土壤呼吸对陆地生态系统碳平衡的干扰,提出了未来降雨对土壤呼吸影响研究需重点关注的3个方面:(1)降雨对土壤呼吸影响的微生物响应机制;(2)区分土壤自养呼吸和异养呼吸对降雨的响应机制;(3)降雨对土壤呼吸影响模型研究。
Effects of dry-wet alternation caused by rainfall on soil respiration: advances and prospects
[J].
Unprecedented decline in photosynthesis caused by summer 2022 record-breaking compound drought-heatwave over Yangtze River basin
[J].DOI:10.1016/j.scib.2023.08.011 URL [本文引用: 1]
近40年青藏高原植被动态变化对水热条件的响应
[J].
Responses of vegetation dynamics to water and heat conditions on the Tibetan Plateau over the past 40 years
[J].
青藏高原植被生长季NDVI时空变化及对气候因子的响应分析
[J].
Analysis of the spatiotemporal changes of NDVI during the growing season of vegetation in the Tibetan Plateau and its response to climate factors
[J].
1982—2019年中国西南地区植被变化归因研究
[J].
DOI:10.11821/dlxb202303013
[本文引用: 1]
西南地区是中国重要的碳汇地区,监测植被动态及探究气候变化和人类活动对植被的影响对于深入了解碳循环机制和促进经济可持续发展至关重要。本文通过融合GIMMS NDVI和SPOT NDVI获得1982—2019年1 km NDVI数据,并结合多时相土地利用数据和气象数据,使用趋势分析、偏相关分析和残差趋势分析探究了西南地区人类活动和气候变化对植被动态的相对贡献。结果表明:① 1982—2019年间西南地区NDVI整体呈上升趋势,年均增速为0.0020 a<sup>-1</sup>;实施退耕还林前NDVI呈下降趋势,实施后转为上升趋势。② 温度和降水整体对NDVI起促进作用,但存在明显的空间异质性。除中心城市外,温度对NDVI主要起促进作用;而降水对西南地区西部NDVI存在抑制作用,对东部NDVI主要起促进作用。③ 随着气候变化和人类活动影响的区域被分离,气候变化对植被恢复的贡献从30.47%增加到60.28%,而人类活动对植被恢复的贡献从69.53%减少至39.72%。本文研究结果表明在人迹稀少的西南地区西部,人类活动对植被的影响可能会进一步下降。
Attribution study of vegetation change in Southwest China from 1982 to 2019
[J].
青藏高原生态系统对气候变化的响应及其反馈
[J].
Responses and feedbacks of the Tibetan Plateau ecosystem to climate change
[J].
Increasing sensitivity of alpine grasslands to climate variability along an elevational gradient on the Qinghai-Tibet Plateau
[J].
Land-atmosphere feedbacks amplify aridity increase over land under global warming
[J].DOI:10.1038/nclimate3029 [本文引用: 1]
A drier future?
[J].DOI:10.1126/science.1247620 PMID:24531959 [本文引用: 1]
Effects of climate extremes on the terrestrial carbon cycle: concepts, processes and potential future impacts
[J].
DOI:10.1111/gcb.12916
PMID:25752680
[本文引用: 1]
Extreme droughts, heat waves, frosts, precipitation, wind storms and other climate extremes may impact the structure, composition and functioning of terrestrial ecosystems, and thus carbon cycling and its feedbacks to the climate system. Yet, the interconnected avenues through which climate extremes drive ecological and physiological processes and alter the carbon balance are poorly understood. Here, we review the literature on carbon cycle relevant responses of ecosystems to extreme climatic events. Given that impacts of climate extremes are considered disturbances, we assume the respective general disturbance-induced mechanisms and processes to also operate in an extreme context. The paucity of well-defined studies currently renders a quantitative meta-analysis impossible, but permits us to develop a deductive framework for identifying the main mechanisms (and coupling thereof) through which climate extremes may act on the carbon cycle. We find that ecosystem responses can exceed the duration of the climate impacts via lagged effects on the carbon cycle. The expected regional impacts of future climate extremes will depend on changes in the probability and severity of their occurrence, on the compound effects and timing of different climate extremes, and on the vulnerability of each land-cover type modulated by management. Although processes and sensitivities differ among biomes, based on expert opinion, we expect forests to exhibit the largest net effect of extremes due to their large carbon pools and fluxes, potentially large indirect and lagged impacts, and long recovery time to regain previous stocks. At the global scale, we presume that droughts have the strongest and most widespread effects on terrestrial carbon cycling. Comparing impacts of climate extremes identified via remote sensing vs. ground-based observational case studies reveals that many regions in the (sub-)tropics are understudied. Hence, regional investigations are needed to allow a global upscaling of the impacts of climate extremes on global carbon-climate feedbacks. © 2015 The Authors. Global Change Biology published by John Wiley & Sons Ltd.
Thermal optimality of net ecosystem exchange of carbon dioxide and underlying mechanisms
[J].
DOI:10.1111/j.1469-8137.2012.04095.x
PMID:22404566
[本文引用: 1]
• It is well established that individual organisms can acclimate and adapt to temperature to optimize their functioning. However, thermal optimization of ecosystems, as an assemblage of organisms, has not been examined at broad spatial and temporal scales. • Here, we compiled data from 169 globally distributed sites of eddy covariance and quantified the temperature response functions of net ecosystem exchange (NEE), an ecosystem-level property, to determine whether NEE shows thermal optimality and to explore the underlying mechanisms. • We found that the temperature response of NEE followed a peak curve, with the optimum temperature (corresponding to the maximum magnitude of NEE) being positively correlated with annual mean temperature over years and across sites. Shifts of the optimum temperature of NEE were mostly a result of temperature acclimation of gross primary productivity (upward shift of optimum temperature) rather than changes in the temperature sensitivity of ecosystem respiration. • Ecosystem-level thermal optimality is a newly revealed ecosystem property, presumably reflecting associated evolutionary adaptation of organisms within ecosystems, and has the potential to significantly regulate ecosystem-climate change feedbacks. The thermal optimality of NEE has implications for understanding fundamental properties of ecosystems in changing environments and benchmarking global models.© 2012 The Authors. New Phytologist © 2012 New Phytologist Trust.
Optimal temperature of vegetation productivity and its linkage with climate and elevation on the Tibetan Plateau
[J].
