

引言
江淮地区(29°45′~35°08′N,115°46′ ~122°12′E)是我国重要的商品粮基地,独特的地理位置和气候条件使其成为水稻种植关键区域。据2022年统计数据,该区域水稻产量占全国总产量的11%,其中一季稻占比达68%。从农业气候区划来看,江淮地区正处于亚热带向暖温带过渡的生态脆弱带,气候变率大,水稻生产同时面临季节性干旱和高温热害的双重威胁。近年来,随着气候变暖加剧,该区域极端气候事件频发,2022年夏季持续高温干旱导致部分地区水稻大幅减产。IPCC第六次评估报告指出,当前全球地表平均温度较工业化前已升高1℃,且未来20年内突破1.5℃阈值的概率达50%[1]。这种变暖趋势将显著改变作物生长的气候适宜性,特别是对温度敏感的稻作系统。已有研究表明,气温每升高1℃,水稻生育期将缩短7~10 d,直接影响干物质积累和产量形成[2]。同时,降水格局的改变(如梅雨期缩短、暴雨日数增加)也会通过影响土壤水分状况而间接调控水稻适生区分布[3-4]。
在研究方法上,物种分布模型(SDMs)已成为评估气候变化对作物适生区影响的重要工具[5-6]。最大熵模型(MaxEnt)因其在小样本条件下的稳定表现备受青睐[7]。然而,文献综述表明,现有研究存在几个明显的局限性:首先,环境因子选择往往过于侧重气候要素(温度、降水等)[8],忽视了土壤特性、地形特征和人类活动的综合影响。Liu等[9]通过对比实验证实,忽略土壤因子会导致水稻适生区范围被高估12%~15%。其次,气候模式数据的可靠性不足,特别是CMIP5模式在中国东部存在系统性偏差(模拟降水比观测值偏高20%~30%),直接影响适生区预测的准确性[10-
1 资料与方法
1.1 研究区域概况
江淮地区涵盖安徽、江苏和上海三省市,在地貌上呈现明显的梯度特征,自西向东可分为3个主要地貌单元(图1):西部及西南部为大别山-皖南山地,海拔多在500 m以上,坡度陡峻(>15°);中部为江淮丘陵,海拔50~200 m,地形起伏相对和缓;东部则为广阔的长江三角洲平原,海拔普遍低于50 m,水网密布。这种复杂的地形格局导致气候要素的空间差异显著,年平均气温从北部的14℃递增至南部的16℃、年降水量则从西北部的800 mm增加到东南部的1200 mm。土壤类型主要包括水稻土、潮土和黄棕壤三大类。其中水稻土占耕地面积的45%,主要分布在沿江平原和里下河地区,其典型特征是具有明显的犁底层和潴育层,有机质含量丰富(2.5%~3.5%);潮土主要分布在淮北平原,受黄河泛滥影响形成,普遍存在盐渍化问题(电导率>4 dS/m);黄棕壤则多见于丘陵地区,肥力中等但保水能力较差。这种土壤分布格局与水稻适生区的空间差异密切相关。在土地利用方面,2020年遥感监测数据显示,研究区耕地占比达45.2%,其中水田占耕地面积的68%,主要分布在沿江平原和太湖流域;旱地占32%,集中在淮北地区。
图1
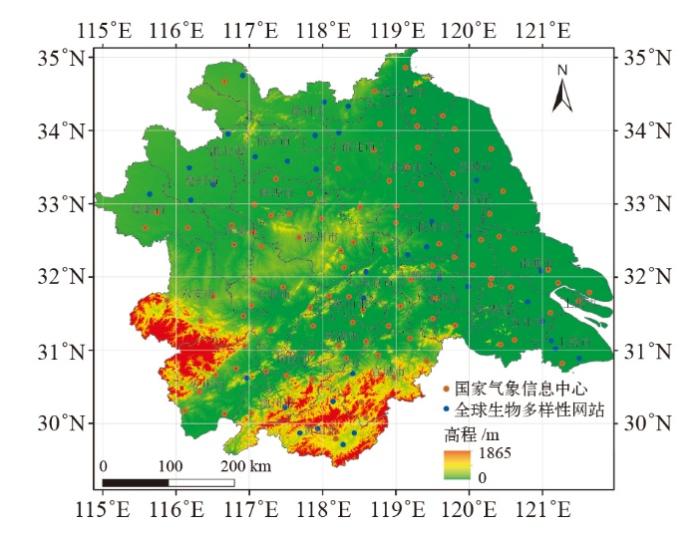
图1
江淮一季稻种植区空间分布
Fig. 1
Potential distribution of single-cropping rice planting areas in the Jianghuai region
1.2 数据
环境数据:地形数据采用国家基础学科公共科学数据中心①(①
一季稻分布数据:来自国家气象信息中心(NMIC)的县级统计资料,结合全球生物多样性网站②(②
1.3 方法
1.3.1 环境因子筛选与优化
基于一季稻的生理生态特性,初步选取了14个潜在影响因子(表2),包括9个气候因子和5个环境因子。气候因子主要反映热量条件(如≥10℃积温、≥10℃持续日数、≥15℃积温、≥15℃持续日数、最暖月平均温度、生物学温度)、水分状况(湿润指数、4—9月降水量)和极端事件(4—9月高温日数);环境因子则涵盖地形(海拔、坡度、坡向)、土壤分类和土地利用。其中湿润指数(I)采用Holdridge生命地带系统方法计算,公式为:
表2 江淮一季稻种植分布的潜在影响因子
Table 2
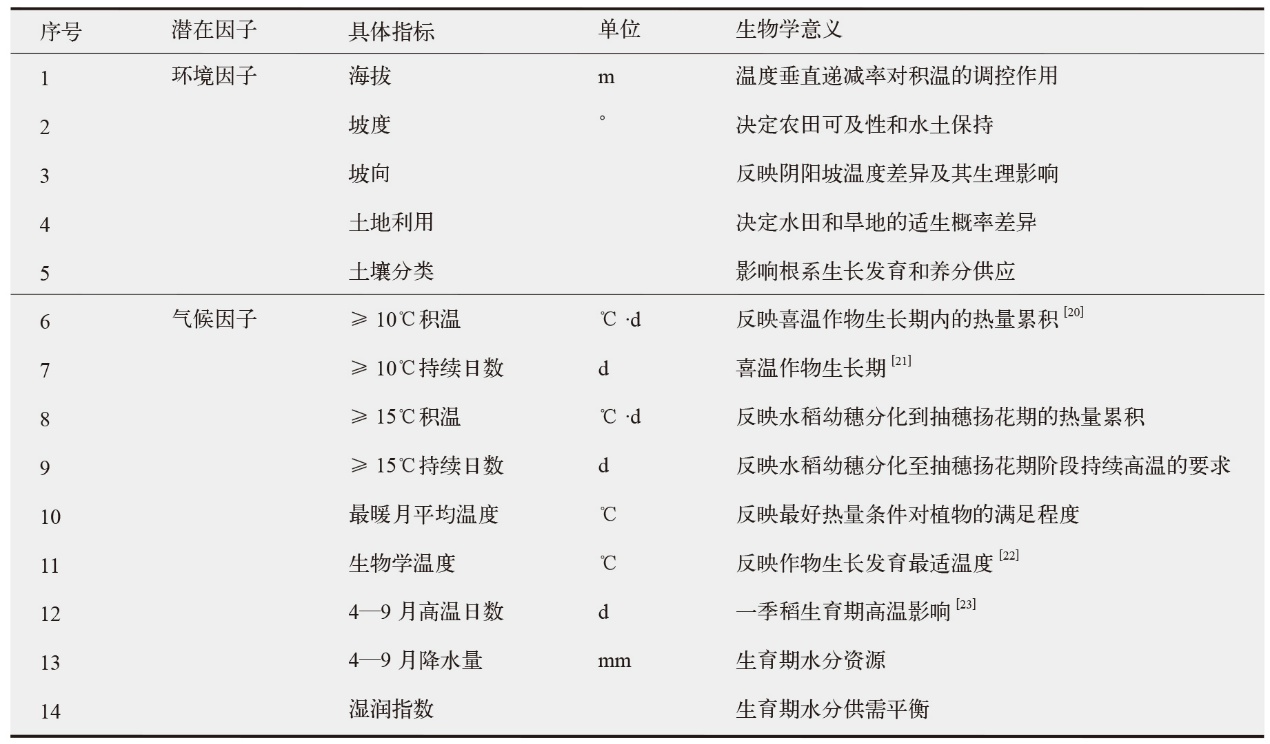 |
式中:P为年降水量;E为生物温度的潜在蒸散;TB为年均生物学温度;T为日平均气温,当T<0℃,取T=0℃,当T>30℃,取T=30℃[24]。
为避免模型过度拟合,采用“VIF筛选+Jackknife检验”的双指标方法进行因子优化。首先,通过方差膨胀因子(VIF)检验,剔除共线性较高(VIF>5)的因子,保留了11个气候环境因子,具体剔除了≥10℃积温、≥15℃持续日数和坡向3个变量。随后,结合刀切法(Jackknife)评估各因子的独立贡献,进一步剔除贡献率<3%的因子。
最终优选出9个主导因子,分别为:土壤分类、湿润指数、土地利用、4—9月高温日数、坡度、≥10℃持续日数、≥15℃积温、最暖月平均温度和生物学温度。这9个因子的累计贡献率达94.4%,其中土壤分类(22.1%) 、湿润指数(18.1%)贡献最大。刀切法检验显示,湿润指数和4—9月高温日数的独立贡献率最高,其训练增益值分别为0.321和0.297,验证了水热条件是制约适宜性的主导因子。
1.3.2 MaxEnt模型参数设置
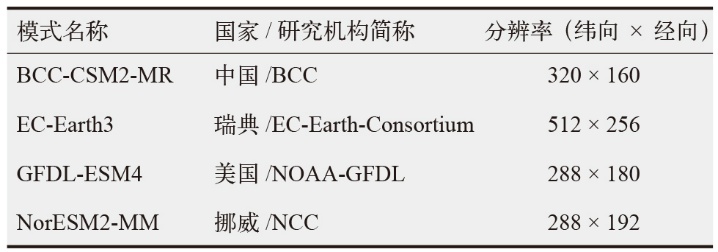
采用Phillips等[7]开发的MaxEnt模型(版本3.3.3a)模拟物种分布。环境因子数据重采样至1 km分辨率,坐标系统一为CGCS2000。设置模型参数为:训练样本占75%,测试样本占25%,默认参数包括正则化参数为1.0,特征组合类型为“线性+二项式+乘积”,最大迭代次数为500次。通过刀切法检验分析环境变量的贡献率和重要性,并使用受试者工作特征曲线(ROC)下面积值(AUC)评估模型精度[16]。AUC值范围为(0,1),超过0.8表示模型精度极好[25]。模型输出的适生概率(0,1)通过自然间隔断点分级法划分为4个适生等级[26]:高适生区(0.4,1.0)、中适生区(0.25,0.4]、低适生区(0.1,0.25]和非适生区(0,0.1]。
经过上述环境因子筛选后,模型的预测性能显著提升:AUC值从初始的0.871提升至0.923,测试集AUC标准差也由0.018降至0.009,表明模型过拟合风险降低,预测稳定性增强[27]。
1.3.3 气候模式评估
图2
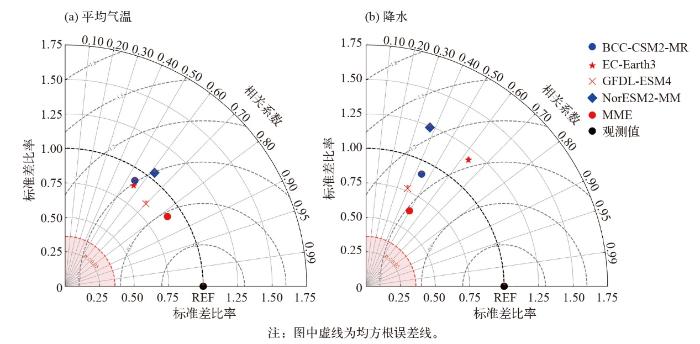
图2
泰勒图评估CMIP6模式模拟江淮地区4—9月平均气温(a)和降水(b)的能力
注:图中虚线为均方根误差线。
Fig. 2
Taylor diagram of the mean temperature (a) and precipitation (b) during April-September simulated by CMIP6 climate models compared with observations
1.3.4 适生区演变类型划分
为量化未来适生区的空间演变,依据基准期至未来时期适生区等级的转换关系,定义以下三类演变区域:(1)收缩区:指适生区等级发生退化的像元集合,即从高适生区退化为中或低适生区,以及从中适生区退化为低适生区的区域。(2)扩展区:指适生区等级得到改善的像元集合,即从非适生区转为低、中或高适生区,以及从低适生区转为中或高适生区的区域。(3)稳定区:指适生区等级未发生变化的像元集合。
2 结果与分析
2.1 一季稻全生育期气候变化预估
2026—2100年,江淮一季稻全生育期平均气温呈显著上升(图3a)。在SSP1-2.6、SSP2-4.5和SSP5-8.5情景下,升温速率分别为0.08、0.28和0.50℃/(10 a),其中SSP2-4.5和SSP5-8.5情景的升温趋势通过0.01显著性检验。空间分布上(图略),江淮地区西北部升温速率高于东南部。从3种SSP情景数据气温平均值看,与基准期(1985—2014年一季稻全生育期多年平均值)相比,未来近期、中期和远期,一季稻全生育期平均气温升幅分别为1.3、2.2和2.9℃,其中远期SSP5-8.5情景下升温幅度达3.9℃。
图3
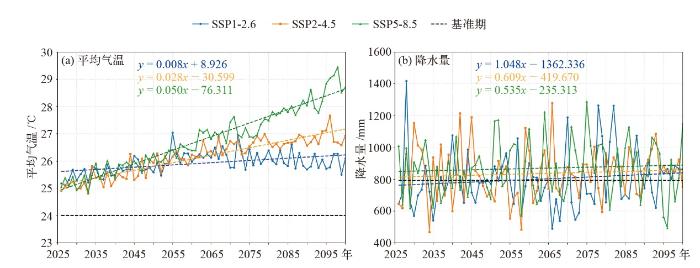
图3
2026—2100年不同情景一季稻全生育期平均气温(a)和降水量(b)变化预估
Fig. 3
Projected changes in mean temperature (a) and precipitation (b) during the entire growth period of single-cropping rice under different SSPs scenarios from 2026 to 2100
江淮一季稻全生育期降水量年际波动显著,总体呈增加趋势(图3b)。在SSP1-2.6、SSP2-4.5和SSP5-8.5情景下,降水增加率分别为10.5、6.1和5.4 mm/(10 a),其中SSP1-2.6情景的趋势通过0.05显著性检验。空间分布上(图略),江淮地区中北部降水增加趋势高于南部。与基准期相比,SSP1-2.6情景下未来近期和中期降水量分别减少4.6%和0.6%,远期增加7.6%;SSP2-4.5和SSP5-8.5情景下均增加,其中远期SSP5-8.5情景增幅达15.8%。
2.2 影响一季稻分布主导因子及适生区模拟
基于1.3.1节通过“双指标筛选”法确定的9个主导因子,模拟了江淮一季稻的潜在适生区。模拟结果表明,土壤分类与湿润指数是贡献率最高的两个影响因子,这凸显了土壤性质与水分平衡在适生区形成中的关键作用。
在气候基准期(1985—2014年),江淮一季稻种植潜在分布空间差异显著(图4)。(1)高适生区集中分布于长江三角洲和沿江平原,包括太湖流域、里下河地区和巢湖周边,占总面积的21.7%。该区域土壤以潜育型水稻土为主,水热条件优越,≥15℃积温4500~4985℃·d,湿润指数0.65~0.80;高温日数适中(10~20 d),既满足热量需求又避免热害。(2)中适生区集中分布在淮河以南平原区,占总面积的26.2%。土壤组合复杂(水稻土占60%、潮土占25%、黄棕壤占15%),热量条件良好(≥15℃积温4000~4500℃·d),但降水变率大(25%~30%),通过灌溉措施可提升至高度适宜。(3)低适生区分布在淮北平原,占总面积的35.1%。该区域土壤存在盐渍化和砂姜黑土障碍层;≥15℃积温3500~4000℃·d,≥10℃持续日数<230 d,热量和降水量不足且降水变率大,湿润指数0.4~0.5,需依赖灌溉。(4)非适生区包括大别山区和皖南山区(坡度>15°,海拔>300 m)、西北部旱地(降水量不足600 mm)及城市化区域,占总面积的17.1%。
图4
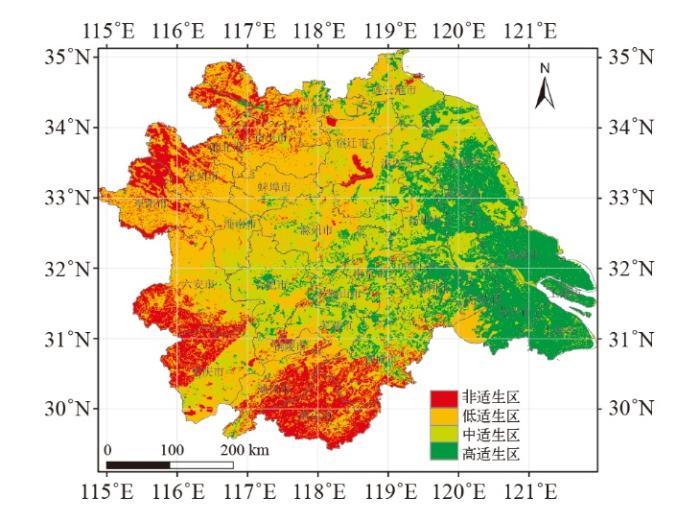
图4
气候基准期江淮一季稻种植潜在分布格局
Fig. 4
Potential distribution pattern of single-cropping rice planting in the Jianghuai region during the baseline period of model hindcasting
2.3 未来一季稻潜在适生区演变
基于气候基准期及未来3种SSP情景数据模拟,评估了一季稻潜在适生区的演变特征(表3)。结果表明,适生区等级动态变化呈现非对称性迁移特征。具体表现为:生态适宜性退化主要包括高适生区向中、低适生区的转化,以及中适生区向低适生区的转化;而适生性改善则涵盖非适生区向低、中、高适生区的转化,以及低适生区向中、高适生区的转化。在远期SSP5-8.5情景下,这种“高→中→低”的级联退化模式最显著。
表3 基准期和未来情景下一季稻适生区面积占比
Table 3
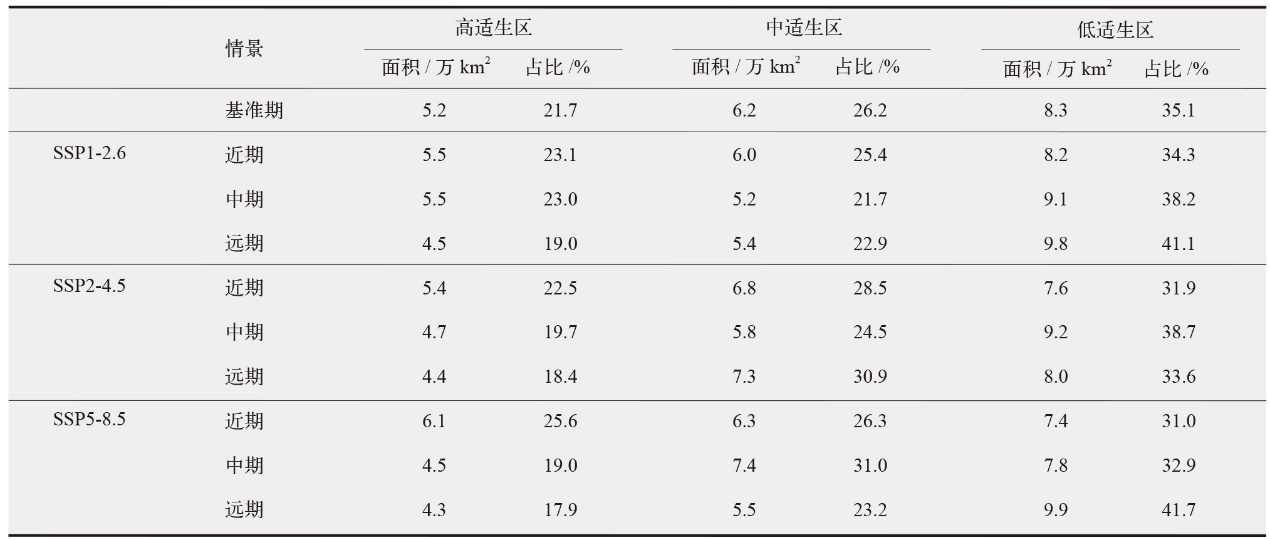 |
从时段变化看(取3种SSP情景的平均值),近期因热量资源优化呈现短暂的改善趋势,高适生区面积增加2.1个百分点,主要来自中适生区的升级;而中远期则持续退化,远期高适生区面积减少3.2个百分点(其中SSP5-8.5减少3.8个百分点),减少部分中72%转化为中适生区,28%直接降为低适生区。同期,远期低适生区面积也整体增加,其中SSP5-8.5增幅达6.6个百分点。
不同情景对比表明:适生区演变不同情景模式差异显著,SSP1-2.6情景下各等级面积变幅均小于6个百分点,尤其是近期和中期变幅总体在3个百分点内,结构相对稳定;SSP2-4.5情景下高适生区在近期基本稳定,但中远期持续减少;而SSP5-8.5情景则表现出“先增后减”的独特变化,近期因热量条件改善,高适生区有所增加,但至远期则因极端高温的阈值效应影响,显著减少3.8个百分点,同时中适生区向低适生区的转化率高达15.3%。
图5展示了未来一季稻潜在适生区空间格局演变。扩展区:集中在33°N以北(安徽北部),低适生区向中高适生区转化,核心驱动因素为“热量优化+降水改善”的双重利好,除≥10℃积温增加300~450℃·d、生育期延长12~18 d外,SSP1-2.6 情景下远期该区域降水增幅达7.6%,有效缓解土壤干旱(湿润指数从基准期的0.4~0.5提升至0.5~0.6),精准匹配一季稻关键生育期水分需求,形成“水热协同”效应,推动适生区等级提升。
图5
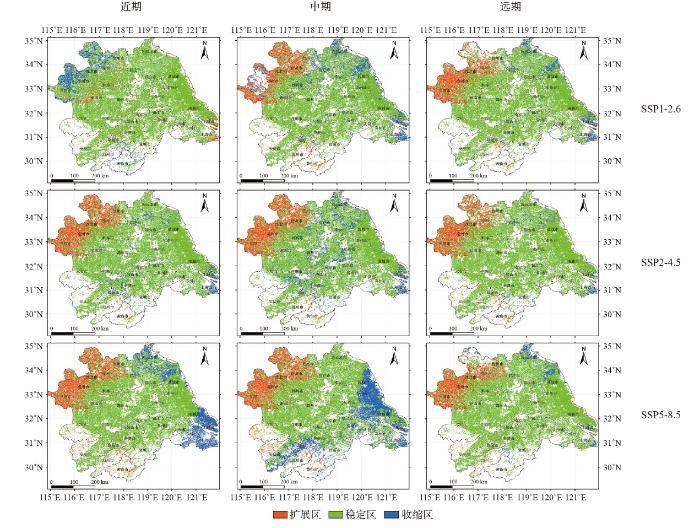
图5
不同SSP情景下江淮一季稻适生区变化
Fig. 5
Comparison of the potential spatial distribution pattern changes of single-cropping rice planting in 2026-2040, 2041-2070, and 2071-2100 relative to the baseline period
稳定区:江淮中部(32°~33°N)适生等级保持相对稳定,面积占比维持在(35±2)%,既受益于适度的热量增加(≥15℃积温提升 200~300℃·d),又因降水变率较小(<20%)未出现明显水热失衡,体现过渡带的气候韧性。
收缩区:不仅包括32°N以南(江苏南部及上海),还包括32°N以北的部分区域,如SSP1-2.6情景下近期的安徽西北部和中远期的江苏东部。这种退化与孕穗期极端高温事件频次增加(高温日数显著增加至35~45 d,p<0.001;极端高温在关键生育期发生概率较基准期增加3~5倍)显著相关(表4)。
表4 SSP5-8.5情景下江苏南部(32°N以南)高温日数与极端高温概率变化
Table 4
 |
这种“东缩北扩”空间重构具有显著情景依赖性:SSP5-8.5情景下收缩/扩展强度是SSP1-2.6的3.2倍,表明高排放情景将加速适生区格局的重组。研究建议将32°N作为种植布局调整的关键纬度带,北部重点发展耐寒晚熟品种,南部需强化高温抗逆品种选育,同时优化田间排灌系统以应对降水变率加大的挑战。
3 结论与讨论
3.1 结论
本文耦合土壤、地形、人类活动因子,构建高精度适生区预测模型(AUC>0.9),弥补传统气候模型的不足,得出以下主要结论。
(1)通过耦合土壤、地形及人类活动因子,构建了高精度适生区预测模型,采用“双指标筛选”方法,剔除贡献率<3%或共线性(VIF>5)的冗余因子后,AUC值由0.871提升至0.923,变量累计贡献率提高到94.4%。测试集AUC标准差由0.018降至0.009,模型过拟合风险降低,增强了模型预测的稳健性。
(2)未来江淮一季稻全生育期平均气温显著升高,SSP5-8.5情景下升温率最大,江淮地区西北部升温高于东南部;降水量总体呈增加趋势,SSP1-2.6情景增幅最显著,江淮地区中北部降水增加高于南部。未来水热条件的变化,尤其是高温和降水的不均匀分布,将对一季稻生长环境产生深远影响。具体表现为,西北部热量资源的增加可能缓解部分区域的低温限制,但东南部极端高温事件的频发可能加剧水稻热害风险,而降水分布的不均匀性则可能引发局部干旱或洪涝灾害,进一步影响一季稻的稳产性。
(3)未来江淮一季稻适生区整体呈现“东缩北扩”的趋势,表现为高适生区面积缩减、低适生区面积显著增加。安徽北部为主要的扩展区域,而江淮东部及南部地区适生区面积有所减少,两者共同反映气候变暖的“双刃剑”效应。未来需针对不同区域的气候变化特征,优化种植布局并制定适应性管理措施,以应对气候变化对一季稻生产的潜在影响。
3.2 讨论
本文构建了“气候-土壤-地形”多因子耦合评估框架,其中包括采用多模式集合(MME)优化气温模拟,结合EC-Earth3单模式降水数据,将气候数据的空间相关系数提升至0.81(气温)和0.63(降水);通过“双指标筛选”(VIF<5或贡献度>3%)从14个潜在因子中确定9个主导因子,使模型AUC值提升至0.923;此外,本文还量化了非气候因子(土壤类型贡献率22.1%,土地利用13.7%)对适生区分布的协同影响。这些改进显著提升适生区预估的可靠性,为农业气候风险评估提供了新方法。
研究揭示了气候变暖的“双刃剑”效应,从消极方面看,SSP5-8.5情景下高适生区远期减少3.8个百分点,主要由于气候变暖导致的极端高温和降水变率增加。然而,从积极方面看,安徽北部低适生区向中高适生区转化6.6个百分点,得益于≥15℃积温增加300℃·d。这种“东缩北扩”的空间重构特征为区域种植布局优化提供了直接依据。
尽管本研究在数据来源和模型方法上有所改进,显著提高了适生区预估的可靠性,但仍存在一些局限性需要进一步研究解决。例如,CMIP6模式对降水的模拟能力仍有待提高,尤其是在区域尺度上,降水模拟的不确定性可能影响适生区预估的精度。未来可以结合更多高分辨率模式数据或统计降尺度方法,进一步提高模拟精度。此外,本研究主要关注气候环境因子对适生区分布的影响,未来可以进一步考虑社会经济因素(如农业政策、技术进步等)对作物适生区的影响。例如,农业技术的进步可能通过品种改良和栽培技术优化部分抵消气候变化的不利影响,而政策支持则可能通过调整种植结构或推广适应性措施提升区域农业韧性。
参考文献
Influence of temperature and sunlight on growth and yield of rice in different growth stages in Xuancheng area
[J].
Climate trends and global crop production since 1980
[J].
DOI:10.1126/science.1204531
PMID:21551030
[本文引用: 1]

Efforts to anticipate how climate change will affect future food availability can benefit from understanding the impacts of changes to date. We found that in the cropping regions and growing seasons of most countries, with the important exception of the United States, temperature trends from 1980 to 2008 exceeded one standard deviation of historic year-to-year variability. Models that link yields of the four largest commodity crops to weather indicate that global maize and wheat production declined by 3.8 and 5.5%, respectively, relative to a counterfactual without climate trends. For soybeans and rice, winners and losers largely balanced out. Climate trends were large enough in some countries to offset a significant portion of the increases in average yields that arose from technology, carbon dioxide fertilization, and other factors.
中国双季稻种植区的气候适宜性研究
[J].
DOI:10.3864/j.issn.0578-1752.2012.02.003
[本文引用: 1]
【目的】从国家层次和年尺度阐明影响中国双季稻种植分布的主导气候因子,揭示中国双季稻种植分布及其气候适宜性,可为优化双季稻生产布局、改进种植制度和确保粮食生产安全提供科学依据。【方法】从中国区域和年尺度选取影响中国水稻种植分布的潜在气候因子,利用双季稻的地理分布信息及其对应的气候资料,结合最大熵模型和ArcGIS软件的空间分析功能,阐明影响中国双季稻种植分布的主导气候因子并构建中国双季稻种植分布与气候的关系模型。【结果】影响中国双季稻种植分布的主导气候因子有:年降水量、最暖月平均气温和稳定通过18℃持续日数,它们对双季稻种植分布的累积贡献率达潜在气候因子的99.1%;基于主导气候因子和最大熵模型构建的中国双季稻种植分布与气候的关系模型能够很好地模拟中国双季稻种植区分布;中国适宜种植双季稻的国土面积达174万km2,远大于目前种植面积;根据待预测区双季稻的存在概率给出了中国双季稻种植区的气候适宜性分区,并分析了各气候适宜区的主导气候因子特征。【结论】利用最大熵模型构建的中国双季稻分布与气候的关系模型揭示了中国双季稻种植区的潜在分布及其气候适宜性,从气候适宜性角度来说,中国双季稻种植面积还有很大的扩展潜力。
Climatic suitability of double rice planting regions in China
[J].
Spatio-temporal variations in the areas suitable for the cultivation of rice and maize in China under future climate scenarios
[J].
Maximum entropy modeling of species geographic distributions
[J].DOI:10.1016/j.ecolmodel.2005.03.026 URL [本文引用: 2]
基于MaxEnt模型预测未来气候变化情景下中国区域水稻潜在适生区的变化
[J].
Predicting potential suitable planting area of rice in China under future climate change scenarios using the MaxEnt model
[J].
Quantitative evaluation and mechanism analysis of soil chemical factors affecting rice yield in saline-sodic paddy field
[J].DOI:10.1016/j.agwat.2023.108523 URL [本文引用: 1]
基于CMIP5模式安徽省植被净初级生产力预估
[J].
Projection of vegetation net primary productivity based on CMIP5 models in Anhui province
[J].
CMIP6模式对亚洲中高纬区极端温度变化的模拟及预估
[J].
Assessment and projection of changes in temperature extremes over the mid-high latitudes of Asia based on CMIP6 models
[J].
Impacts of 1.5 and 2℃ global warming on water availability and extreme hydrological events in Yiluo and Beijiang River catchments in China
[J].DOI:10.1007/s10584-017-2067-0 URL [本文引用: 1]
Maxent modelling predicts a shift in suitable habitats of a subtropical evergreen tree (Cyclobalanopsis glauca (Thunberg) Oersted) under climate change scenarios in China
[J].
DOI:10.3390/f13010126
URL
[本文引用: 1]
Climate change has caused substantial shifts in the geographical distribution of many species. There is growing evidence that many species are migrating in response to climate change. Changes in the distribution of dominant tree species induced by climate change can have an impact not only on organisms such as epiphytes and understory vegetation, but also on the whole ecosystem. Cyclobalanopsis glauca is a dominant tree species in the mingled evergreen and deciduous broadleaf forests of China. Understanding their adaptive strategies against climate change is important for understanding the future community structure. We employed the Maxent framework to model current suitable habitats of C. glauca under current climate conditions and predicted it onto the climate scenarios for 2041–2060 and 2081–2100 using 315 occurrence data. Our results showed that annual precipitation was the most critical factor for the distribution of C. glauca. In the future, increasing precipitation would reduce the limitation of water on habitats, leading to an expansion of the distribution to a higher latitude and higher altitude. At the same time, there were habitat contractions at the junction of the Jiangxi and Fujian Provinces. This study can provide vital information for the management of C. glauca, and serve as a reminder for managers to protect C. glauca in the range contraction areas.
Projection of climate extremes in China, an incremental exercise from CMIP5 to CMIP6
[J].
DOI:10.1016/j.scib.2021.07.026
PMID:36654212
[本文引用: 1]
This paper presents projections of climate extremes over China under global warming of 1.5, 2, and 3 °C above pre-industrial (1861-1900), based on the latest Coupled Model Intercomparison Project phase 6 (CMIP6) simulations. Results are compared with what produced by the precedent phase of the project, CMIP5. Model evaluation for the reference period (1985-2005) indicates that CMIP6 models outperform their predecessors in CMIP5, especially in simulating precipitation extremes. Areal averages for changes of most indices are found larger in CMIP6 than in CMIP5. The emblematic annual mean temperature, when averaged over the whole of China in CMIP6, increases by 1.49, 2.21, and 3.53 °C (relative to 1985-2005) for 1.5, 2, and 3 °C above-preindustrial global warming levels, while the counterpart in CMIP5 is 1.20, 1.93 and 3.39 °C respectively. Similarly, total precipitation increases by 5.3%, 8.6%, and 16.3% in CMIP6 and by 4.4%, 7.0% and 12.8% in CMIP5, respectively. The spatial distribution of changes for extreme indices is generally consistent in both CMIP5 and CMIP6, but with significantly higher increases in CMIP6 over Northeast and Northwest China for the hottest day temperature, and South China for the coldest night temperature. In the south bank of the Yangtze River, and most regions around 40°N, CMIP6 shows higher increases for both total precipitation and heavy precipitation. The projected difference between CMIP6 and CMIP5 is mainly attributable to the physical upgrading of climate models and largely independent from their emission scenarios.Copyright © 2021 Science China Press. Published by Elsevier B.V. All rights reserved.
Does CMIP6 inspire more confidence in simulating climate extremes over China?
[J].
Uncertainty in projection of climate extremes: a comparison of CMIP5 and CMIP6
[J].DOI:10.1007/s13351-021-1012-3 [本文引用: 2]
Maxent modeling for predicting suitable habitat for threatened and endangered tree Canacomyrica monticola in New Caledonia
[J].
A trend-preserving bias correction the ISI-MIP approach
[J].
DOI:10.5194/esd-4-219-2013
URL
[本文引用: 1]
. Statistical bias correction is commonly applied within climate impact modelling to correct climate model data for systematic deviations of the simulated historical data from observations. Methods are based on transfer functions generated to map the distribution of the simulated historical data to that of the observations. Those are subsequently applied to correct the future projections. Here, we present the bias correction method that was developed within ISI-MIP, the first Inter-Sectoral Impact Model Intercomparison Project. ISI-MIP is designed to synthesise impact projections in the agriculture, water, biome, health, and infrastructure sectors at different levels of global warming. Bias-corrected climate data that are used as input for the impact simulations could be only provided over land areas. To ensure consistency with the global (land + ocean) temperature information the bias correction method has to preserve the warming signal. Here we present the applied method that preserves the absolute changes in monthly temperature, and relative changes in monthly values of precipitation and the other variables needed for ISI-MIP. The proposed methodology represents a modification of the transfer function approach applied in the Water Model Intercomparison Project (Water-MIP). Correction of the monthly mean is followed by correction of the daily variability about the monthly mean. Besides the general idea and technical details of the ISI-MIP method, we show and discuss the potential and limitations of the applied bias correction. In particular, while the trend and the long-term mean are well represented, limitations with regards to the adjustment of the variability persist which may affect, e.g. small scale features or extremes.
Multi-model climate impact assessment and intercomparison for three large-scale river basins on three continents
[J].
我国南方稻区种植制度的气候区划
[J].
Regionalization of cropping systems in rice growing regions in South China
[J].
基于CMIP6的长江中下游未来水稻高温热害时空变化特征
[J].
Spatiotemporal variation of future heat damage of rice in the middle and lower reaches of the Yangtze River using CMIP6 projections
[J].
用于全球变化研究的中国植物功能型划分
[J].
DOI:10.17521/cjpe.2005.0012
[本文引用: 1]
植物功能型(Plant functional types, PFTs)作为沟通植物的结构和功能与生态系统属性的桥梁,随着全球变化与植被的关系研究的深入而受到广泛重视。植物功能型的划分依赖于研究的背景、尺度和要解决的问题。为了区域尺度全球变化研究的需要,该文提出了一个基于植物关键特征的植物功能型划分方法。该方法首先选择了6项植物特征,包括3项冠层特征:木本-草本、常绿-落叶和针叶-阔叶,以及3项生理特征:光合途径(C3 / C4)、植物的水分需求和热量需求,作为划分植物功能型的关键特征;然后,先根据植物冠层特征划分得到5个基本类型,再根据水分和热量条件进行详细划分,得到29种备选类型;需要时,再根据研究目的从这29种备选类型中选择所需类型。根据这个方法,在充分考虑了我国季风气候条件下特有的水热配置和高海拔环境对植物的形态和功能特征影响的基础上,从备选类型中选择了一套适合中国气候和植被特征的植物功能型体系。这套体系包括18类植物功能型,其中含7类‘树’功能型、6类‘灌木’功能型和5类‘草’功能型,另根据需要设置2类‘裸地’功能型。并且根据植物的生理生态特征和中国植被的地理分布确定了用于限制植物功能型分布的气候因子,这些气候因子包括绝对最低温度、最暖月平均温度、有效积温、年最热月平均温和最冷月平均温之差、湿润指数、年均降水量。应用表明,这套植物功能型可用于模拟我国植被在当前气候条件下的分布。该研究为发展适于我国的植被模型和区域气候模型、评估全球变化对我国植被的影响及植被变化对气候的反馈作用提供依据与参数。
Defining plant functional types in China for global change studies
[J].DOI:10.17521/cjpe.2005.0012 URL [本文引用: 1]
Ecological niche modeling for assessing potential distribution of Pterocarpus marsupium Roxb. in Ranchi, eastern India
[J].
DOI:10.1111/1440-1703.12176
[本文引用: 1]
The present study was conducted to predict the current and future potential distribution of a tree speciesPterocarpus marsupiumRoxb. in Ranchi, Eastern India using ecological niche modeling. Nine environmental variables comprising of isothermality, precipitation of wettest and warmest quarter, annual temperature range, soil type, human influence index, elevation, slope and land use cover were used to model the distribution of the species. Climatic variables governed the predicted distribution of the species as they contributed 56.7% as compared to the other nonclimatic variables (43.3%). Northern parts exhibited the most suitable niche of the species as compared to south-east and central parts that showed low probability of occurrence due to high disturbances caused by rapid urbanization as well as over exploitation of the species for timber, edible and medicinal uses. The average test area under the receiver operating curve (AUC) (0.921) as well as the partial AUC indicated good model performance. The projected change scenarios of RCP2.6, RCP4.5 and RCP6.0 for the year 2050 reveal that the climatically suitable areas will be drastically reduced in Ranchi. The population of the species is declining due to its exploitation from natural habitats for timber and medicinal uses and is listed as near-threatened by the current IUCN-Red lists. The findings of this paper will help to identify the potential habitats for further conservation of this near-threatened species in the changing climatic conditions and increasing anthropogenic pressure.
基于MaxEnt模型预测未来气候变化情境下红树秋茄在中国潜在适生区的变化
[J].
Predicting potential suitable habitats of Kandelia obovata in China under future climatic scenarios based on MaxEnt model
[J].
Measuring the accuracy of diagnostic systems
[J].
DOI:10.1126/science.3287615
PMID:3287615
[本文引用: 1]
Diagnostic systems of several kinds are used to distinguish between two classes of events, essentially "signals" and "noise". For them, analysis in terms of the "relative operating characteristic" of signal detection theory provides a precise and valid measure of diagnostic accuracy. It is the only measure available that is uninfluenced by decision biases and prior probabilities, and it places the performances of diverse systems on a common, easily interpreted scale. Representative values of this measure are reported here for systems in medical imaging, materials testing, weather forecasting, information retrieval, polygraph lie detection, and aptitude testing. Though the measure itself is sound, the values obtained from tests of diagnostic systems often require qualification because the test data on which they are based are of unsure quality. A common set of problems in testing is faced in all fields. How well these problems are handled, or can be handled in a given field, determines the degree of confidence that can be placed in a measured value of accuracy. Some fields fare much better than others.
Summarizing multiple aspects of model performance in a single diagram
[J].
DOI:10.1029/2000JD900719
URL
[本文引用: 1]
A diagram has been devised that can provide a concise statistical summary of how well patterns match each other in terms of their correlation, their root‐mean‐square difference, and the ratio of their variances. Although the form of this diagram is general, it is especially useful in evaluating complex models, such as those used to study geophysical phenomena. Examples are given showing that the diagram can be used to summarize the relative merits of a collection of different models or to track changes in performance of a model as it is modified. Methods are suggested for indicating on these diagrams the statistical significance of apparent differences and the degree to which observational uncertainty and unforced internal variability limit the expected agreement between model‐simulated and observed behaviors. The geometric relationship between the statistics plotted on the diagram also provides some guidance for devising skill scores that appropriately weight among the various measures of pattern correspondence.
CMIP6情景模式比较计划 (ScenarioMIP) 概况与评述
[J].
Short commentary on CMIP6 Scenario Model Intercomparison Project (ScenarioMIP)
[J].
CMIP6模式对我国西南地区夏季气候变化的模拟和预估
[J].DOI:10.7522/j.issn.1000-0534.2021.00119 [本文引用: 1]
Evaluation and projection of climate change in Southwest China using CMIP6 models
[J].DOI:10.7522/j.issn.1000-0534.2021.00119 [本文引用: 1]
