

引言
本研究选取1981—2020年中国境内2242个气象站点的逐日日照时数数据,首先构建了6个太阳能干旱事件的监测指标。在此基础上,利用森氏斜率与Mann-Kendall非参数检验法,系统揭示了太阳能干旱事件的时空演变趋势;然后运用Mann-Kendall突变检验法,识别其在时间序列上的突变点,并利用小波分析揭示其潜在的周期性规律。最后采用K-means聚类方法,对太阳能干旱进行空间分区,识别其空间聚类格局。本研究旨在为中国太阳能干旱事件的精准监测提供技术支持,并为优化光伏发展模式与分布式光伏规划提供科学依据,为最终实现“双碳”目标下的能源安全与韧性提升提供解决方案。
1 数据与方法
1.1 日照时数来源及质量控制
本文的研究范围涵盖中国境内除台湾岛、香港和澳门以外的区域,采用的逐日日照时数数据来自中国气象局。气象观测日照时数的统计仅针对太阳直接辐射强度≥120 W/m2的时段,以小时为单位,取1位小数点。本研究对1981—2020年的日照时数数据进行了严格的质量控制和筛选。数据筛选标准如下:首先,选取时间序列完整性较高的气象站点,要求站点在研究时段内的总体数据缺失率不超过1%;其次,为确保年际变化分析的可靠性,要求每个年份的数据缺失率均不超过10%;第三,对于缺失值和异常值进行识别和处理。对于符合上述条件的站点,采用历史同期平均值法对缺失数据进行插补,即优先使用历史年份同月同日的平均值进行填充。筛选后最终选取全国2242个气象站点1981—2020年完整的逐日日照时数数据。通过上述筛选和处理流程,确保研究数据的完整性和可靠性。本研究利用ArcGIS10.8软件的反距离插值法进行指标值的空间展布,空间分辨率为0.1°×0.1°。
1.2 研究方法
1.2.1 太阳能干旱事件的识别
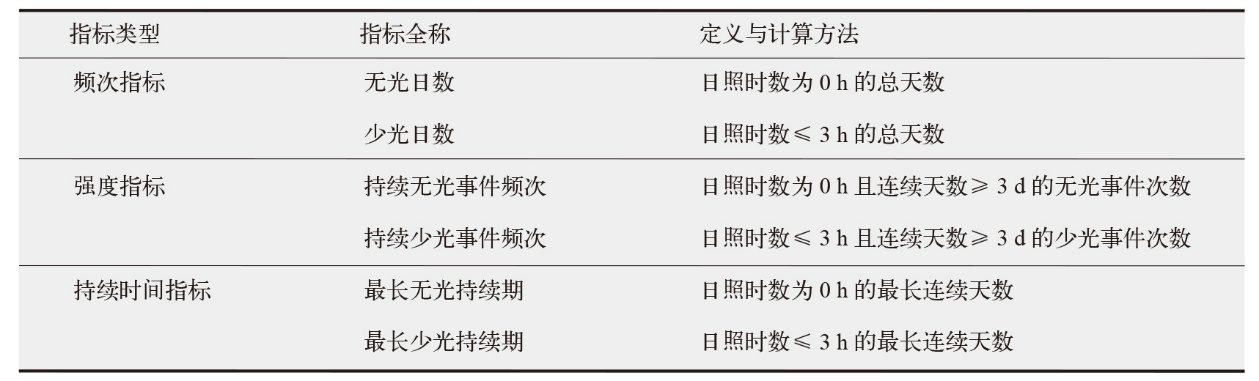
本研究基于日照时数的统计特征,从事件频次、持续性和强度3个维度构建太阳能干旱事件识别指标。其中,单日事件指标反映了太阳能干旱的发生频率,持续性事件指标揭示了连续少光过程的出现规律,而强度指标则表征了极端事件的最大影响程度。这一指标体系综合考虑了太阳能干旱事件对光伏发电、农业生产、人体健康及社会生活等多领域的影响。具体指标定义如表1所示。在频次数据中,日照时数0 h作为绝对下限,对太阳能发电中断影响显著,用于捕捉极端太阳能干旱事件;考虑到光伏系统经济性与稳定性,日照时数不足3 h反映太阳能发电效率下降,用于捕捉日照时数显著偏低但非完全缺失的轻度太阳能干旱事件。通过设定0 h和3 h两个关键阈值,结合不同的时间尺度标准,能够全面刻画太阳能干旱事件的发生特征。
1.2.2 森式斜率与Mann-Kendall非参数检验法
1.2.3 小波分析法
小波分析法是一种用于分析非平稳时间序列数据的时频分析工具。它能够提供时间和频率的局部化信息,适合于识别和分析太阳能干旱事件的时间变化特征[16]。本研究采用Morlet连续小波变换来分析1981—2020年中国太阳能干旱事件的周期性变化特征。
1.2.4 K-means聚类分析法
K-means聚类是一种经典的无监督学习算法,广泛应用于多维气象数据的空间分区。其基本思想是将n个样本{x1,x2,…,xn}划分为k个簇{C1,C2,…,Ck},使簇内样本的相似性最大、簇间差异性最大[17],主要思路是通过最小化簇内平方和实现最优聚类。本研究根据频率指标、强度指标和持续时间指标等6个太阳能干旱指标的K-means聚类结果,将太阳能干旱事件划分为5个等级:微度干旱、轻度干旱、中度干旱、严重干旱和极端干旱。其中微度干旱表现为各项指标处于最低区间;轻度干旱时,日照时数≤3 h的天数较少,持续事件发生频次低且持续时间短;中度干旱表现为各项指标处于中等水平;严重干旱表现为日照时数≤3 h的天数较多,持续事件发生较频繁但持续时间维持在中等范围;极端干旱事件特征最显著,日照时数≤3 h的天数达到最高,持续事件发生频次高且持续时间长。
2 太阳能干旱事件时间特征分析
2.1 太阳能干旱事件年际变化趋势
分析中国1981—2020年太阳能干旱事件6个指标的年际变化,结果表明各指标在时间尺度上呈现出显著差异性变化(图1)。其中持续少光事件频次和最长少光持续期分别以0.0183次/a和0.0119 d/a的速率呈现微弱的上升趋势,但均未通过0.05的显著性水平检验。而持续无光事件频次、少光日数、最长无光持续期和无光日数均表现出显著上升趋势(p<0.05),上升速率分别为0.428次/a、0.2366 d/a、0.471 d/a和0.2800 d/a。总体来说,太阳能干旱事件6个指标在1981—2020年间呈现出不同程度的上升趋势,表明中国太阳能干旱事件总体呈增加趋势,这与任国玉等[18]关于全国日照时数下降的结论一致。
图1
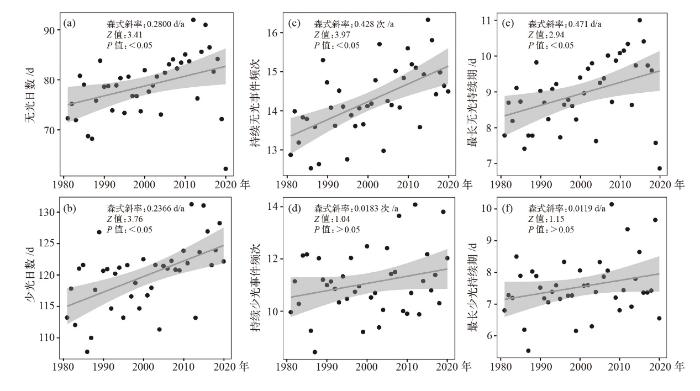
图1
1981—2020年中国太阳能干旱事件年际变化趋势
Fig. 1
Inter-annual variation trend of solar drought events in China from 1981 to 2020
6个指标的MK突变结果(图2)表明,不同指标的趋势转折特征存在显著差异。无光日数、少光日数、持续无光事件频次、持续少光事件频次均在2000年前后出现明显突变,突变后UF序列持续上升并通过0.05的显著性检验,表明太阳能干旱事件频次与持续天数呈显著增加趋势。而最长无光持续期、最长少光持续期的UF与UB序列在1981、1982年等年份多次相交,但均未通过0.05的显著性检验,表明两者未发生突变现象。此外,进一步分析6个指标极值年份可知,在1981、1982、1996、1999、2001、2006和2010年等突变节点对应太阳能干旱事件的极高值或极低值,可视为太阳能干旱事件的典型年份。
图2
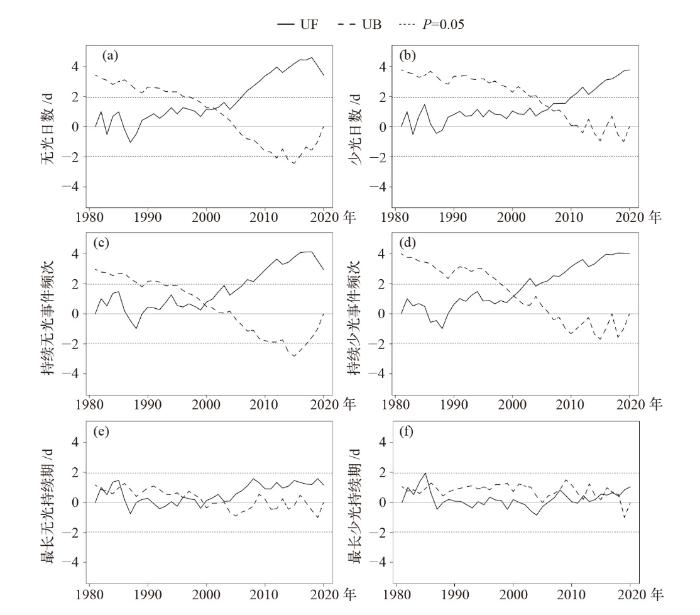
图2
1981—2020年中国太阳能干旱事件MK突变检验结果
Fig. 2
MK mutation test results of solar drought events in China from 1981 to 2020
2.2 太阳能干旱事件季节性特征
为进一步分析太阳能干旱事件季节性差异,针对1981—2020年太阳能干旱事件分别在春、夏、秋、冬季进行统计和分析(图3)。6个指标存在显著的季节性差异。冬季是太阳能干旱事件的“高发季”,其各项太阳能干旱事件指标数值均远高于其他3个季节,而夏季的指标值最小。以最长无光持续期为例,夏季最长无光持续期最大值仅为8 d,连续无光的天数相对较少,太阳能资源的可利用程度较高;而在冬季,最长无光持续期飙升至22 d,表明冬季受太阳能干旱事件影响严重,无光情况发生频繁且持续时间长;春季和秋季的最长无光持续期分别为12 d和14 d。
图3
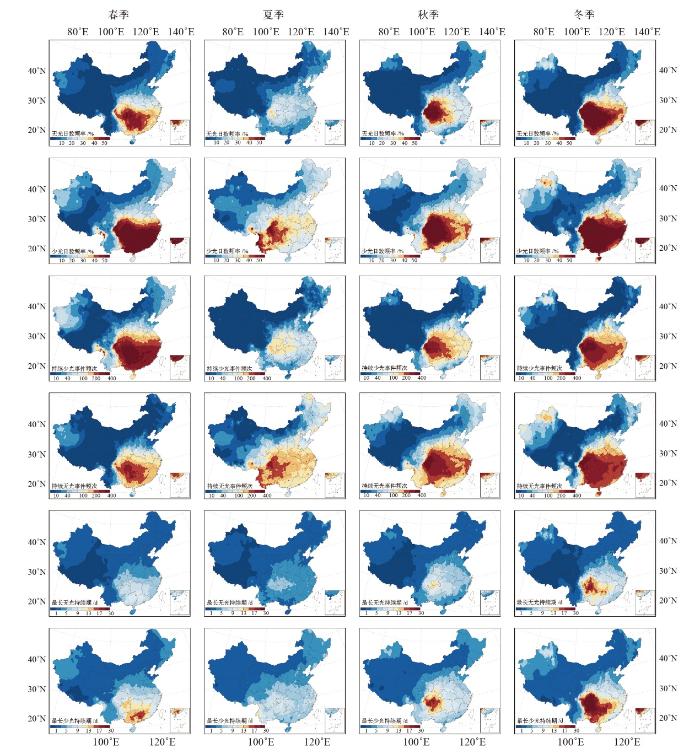
图3
1981—2020年各季节中国太阳能干旱事件6个指标分布
Fig. 3
Distribution of solar drought event indicators in China for each season from 1981 to 2020
2.3 太阳能干旱事件周期性特征
为探究1981—2020年全国太阳能干旱事件的周期规律,对其Morlet小波及其功率谱进行分析,结果如图4所示,其中左侧为小波功率谱,轮廓越密集代表小波功率越大;红线表示太阳能干旱事件的各指标周期;右侧为全局小波谱和显著性检验,虚线小于小波功率谱曲线时,对应周期在0.05水平下具有显著性。结果表明,全国太阳能干旱事件指数周期存在明显差异,各周期强度功率谱不同。无光日数的小波功率谱主要存在1~4 a和4~6 a周期,其年份主要对应1982—1992年和2010—2020年,且右侧小波全谱显示这些周期通过了0.05的显著性检验。少光日数的小波功率谱周期变化与无光日数相似,存在1~6 a和1~2 a周期,前者对应1981—1993年和2008—2019年,后者对应1992—2005年。持续无光事件频次和持续少光事件频次的小波功率谱均显示出较强的小周期特征,集中在2~6 a,且在1981—1995年和2000—2020年间表现出较高的功率和显著性。最长无光持续期和最长少光持续期的小波功率谱主要存在2~6 a和1~5 a周期,分别对应1981—1990年和1995—2020年,且均通过了显著性检验。
图4
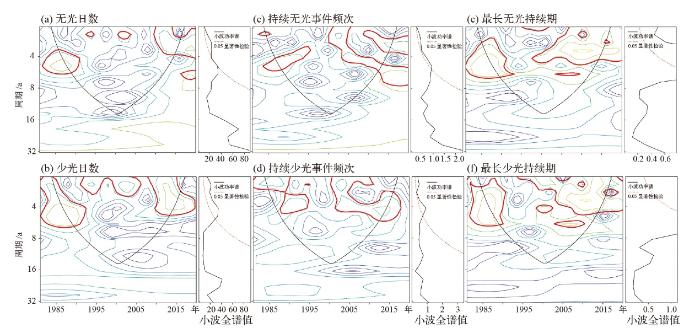
图4
1981—2020年中国太阳能干旱事件Morlet小波变换图
Fig. 4
Morlet wavelet transform chart of solar drought events in China from 1981 to 2020
3 太阳能干旱事件空间特征分析
3.1 太阳能干旱事件空间格局
中国1981—2020年太阳能干旱事件6个指标均呈现出“西低东高、北低南高”的空间分布格局(图5)。在四川盆地及其周边地区,各指标均表现为高值区,其中40年累计无光日数和少光日数占研究时段总日数的比例分别为58.7%和69.6%,说明该区域超过一半的时间处于太阳能极度匮乏状态;多年平均持续无光事件频次最高可达31.85次/a,反映出持续无光事件在该区发生频繁。此外该区域还存在持续两个月以上无光照的极端天气,可能由于四川盆地及其周边地区闭塞的地形导致水汽聚集与低云量增加,形成“华西秋雨”等持续性少光现象,从而导致太阳能干旱处于极端干旱状态,上述现象的出现进一步印证了李小军等[19]提出的云量是太阳辐射主要影响因素的观点。长江中下游地区无光日数和少光日数分别占研究时段总日数的比例介于41.1%~44.5%和44.5%~58.2%之间,并且最长无光持续期最长可达55 d左右,表明该地区太阳能资源匮乏程度仅次于四川盆地。华北平原等地区各项指标处于中等水平,表明该区域虽不极端,但太阳能资源仍对其资源利用造成一定限制,可能与工业化进程中气溶胶排放增加直接相关,这与Mann-Kendall突变检验显示的2000年后趋势增强的时间节点高度吻合,表明人类活动对该区太阳能干旱事件的影响随时间逐渐凸显[6]。东北平原40年累计少光日数占总日数的10.3%~20.5%,其他指标也处于低值范围,说明该区太阳能资源具备较好可利用性。西北内陆地区40年累计无光日数和少光日数仅占总日数的0.16%和2.35%,持续无光事件频次为2次,最长无光持续期最长为2~5 d,是全国太阳能资源开发的最优区域。
图5
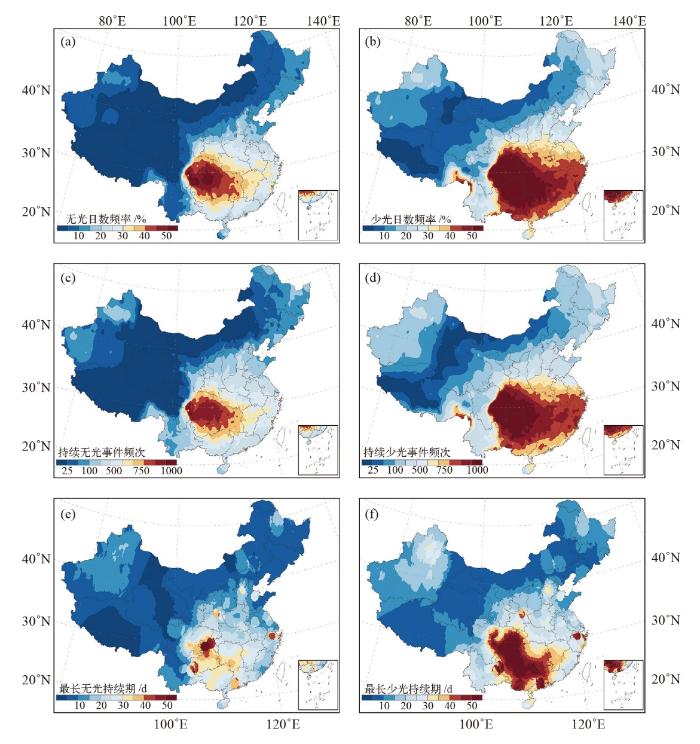
图5
1981—2020年中国太阳能干旱事件6个指标的多年空间格局分布
Fig. 5
Spatial distribution of solar drought event indicators in China from 1981 to 2020
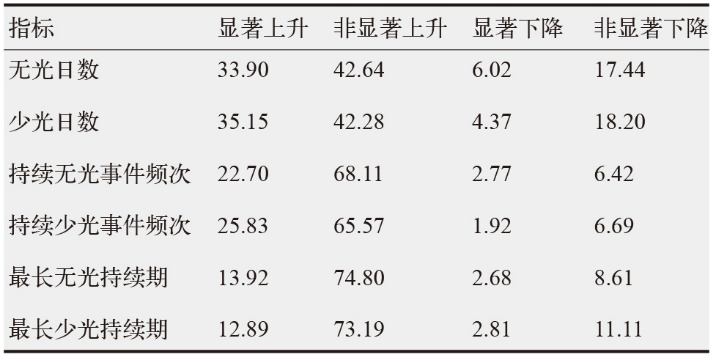
近40年来我国太阳能干旱事件的变化趋势呈现出显著的空间差异(图6),尤其在华北平原至长江中下游地区表现出明显的增加趋势,反映出太阳能干旱现象在该区域逐渐加剧,这与何彬方等[20]发现的安徽省日照时数减少现象一致。从多个指标的变化情况来看,无光日数与少光日数在河北、河南、山东等省份形成高值集中区,斜率值普遍较大,表明这些地区太阳能干旱事件的发生频次和持续时间均呈上升趋势,即太阳能干旱事件日趋加剧。由表2可见,无光日数与少光日数显著上升站点的占比分别为33.90%和35.15%;持续无光事件频次和持续少光事件频次显著上升站点的占比分别为22.70%和25.83%。虽然最长无光持续期和最长少光持续期显著上升站点的占比较低,但在河北、江苏等地仍存在持续性事件增加的聚集现象。相较于中东部地区的显著增加,华南、西南及东北地区大多变化不显著或呈下降趋势。而在四川盆地,最长少光持续期的变化呈现出空间不均性,局部区域存在增加与减少并存的现象。此外,青藏高原西部日照时数增加的局部特征与华维等[21]的研究结果存在差异,这可能因为后者关注年日照时数总量变化,而本研究选用多维度指标(频次、持续期、强度),并设定0 h和3 h双阈值界定极端事件,能更敏感地捕捉到短周期、高强度少光事件的演变特征。
图6
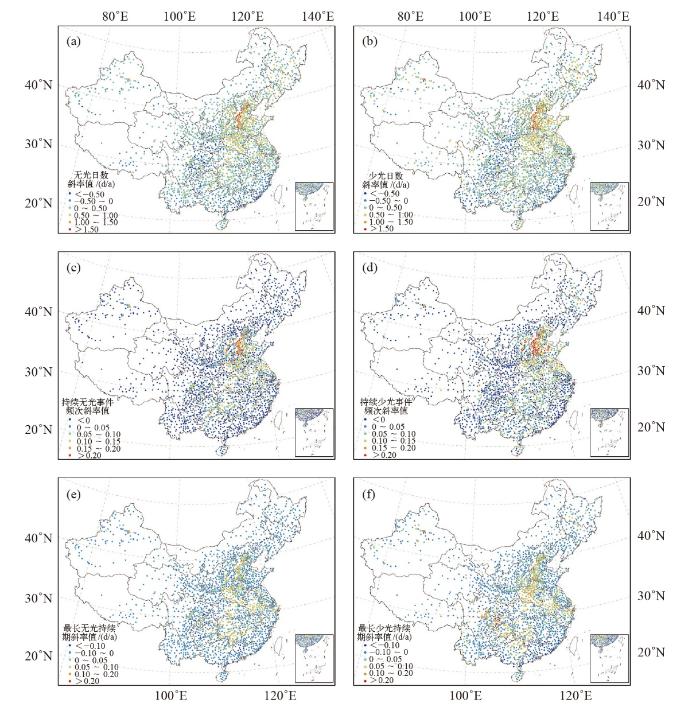
图6
1981—2020年中国太阳能干旱事件6个指标变化趋势空间分布
Fig. 6
Spatial distribution of variation trends for solar drought event indicators in China from 1981 to 2020
表2 1981—2020年中国太阳能干旱事件6个指标变化趋势显著性检验结果的站点占比
Table 2
 |
3.2 太阳能干旱事件区划
中国1981—2020年太阳能干旱事件空间聚类结果(图7)表明,中国太阳能干旱事件呈现“西低东高、北低南高”的空间分布特征,并可划分为5类区域。其中,四川盆地及云贵高原东部构成极端干旱区,湖南全省均位于该区,该区域受地形和季风气候的双重影响,形成的持续性多云雨天气导致日照时数≤3 h的天数最多,且事件持续频次和持续时间较长,表现出典型的太阳能干旱特征。与此相应,四川盆地及其周边地区在无光照日数(8563 d)和少光日数(10165 d)上表现出极端集中的特征,该区研究期内58.71%的日数为无光照日,且70%的日数光照时间不足3 h,说明该区域长期处于太阳能干旱状态。长江中下游地区为严重干旱区,受亚热带季风气候影响,周边湖北、江西等地区无光照日数在6000~6500 d之间,少光日数在6500~8500 d,持续性和极端性弱于四川盆地。华北平原等地区为中度干旱区,主要受冬季雾霾影响,日照时数在一定程度上减少。东北东部地区和青藏高原-西北干旱区分别为轻度干旱区和微度干旱区,后者因高原大气稀薄和云量稀少几乎不存在长时间的无日照或少光现象,成为全国太阳能资源最丰富的区域。
图7
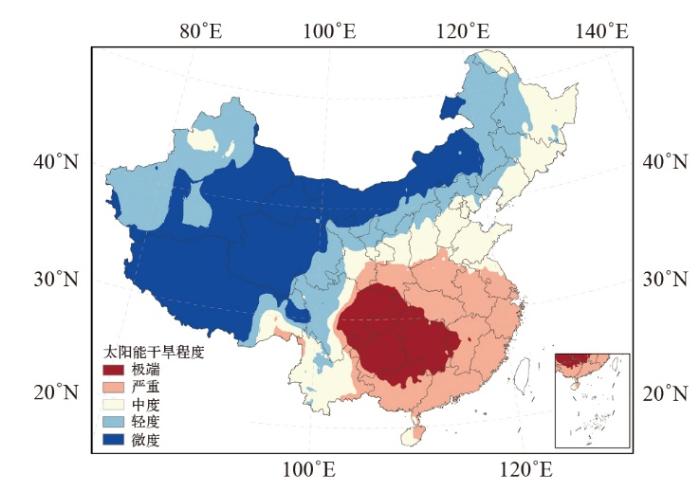
图7
1981—2020年中国太阳能干旱事件空间聚类分布
Fig. 7
Spatial cluster distribution of solar drought events in China from 1981 to 2020
研究发现太阳能干旱事件空间聚类结果与我国发布的太阳能资源分布表在空间分布上非常相似,但现行的资源区划主要基于静态的、总量导向的指标,未能充分反映太阳能资源的波动性与极端风险。本研究结果可作为现有资源区划的有力补充,未来可将太阳能干旱事件区划与之结合,能够更精准地刻画太阳能干旱事件的发生规律,从而构建动态的、风险导向的太阳能资源区划,这对于保障电网稳定性和光伏电站的经济性至关重要。此外,本研究发现四川盆地与西北地区在太阳能干旱事件上呈现极端差异,这种差异对能源开发与生态系统产生深远影响。在太阳能利用方面,四川盆地少光事件频发,导致光伏电站发电效率较西北地区低,需配置储能容量应对持续少光事件,但是四川盆地具备良好的水能资源优势,且电网接入条件较好,更适合水光互补发电模式;西北地区极少的少光日数使其成为理想的集中式光伏基地。生态层面,四川盆地长期少光胁迫导致森林植被净初级生产力比西北地区低[22],而西北地区充足的光照使高寒草甸碳汇能力比前者高[23],加剧了我国“东碳源-西碳汇”的生态格局。针对这种区域分异,建议采取基于地理特征差异化的太阳能资源开发利用策略,为“双碳”目标下能源安全与生态保护的协同管理提供科学支撑。
4 结论
本研究基于中国1981—2020年的逐日日照时数数据,开展了6类太阳能干旱事件指标的特征分析。主要结论如下。
(1) 1981—2020年中国太阳能干旱事件多项指标呈上升趋势,其中无光日数、少光日数、持续无光事件频次和最长无光持续期呈显著上升趋势,且突变点主要集中在21世纪初。
(2)中国1981—2020年太阳能干旱事件存在多时间尺度特征,各指标主要以2~6 a为主周期,且在不同时间段存在显著变化的周期性特征。
(3)太阳能干旱事件各指标均呈现“西低东高、北低南高”的空间分布特征,四川盆地为高值核心区,而西北内陆和东北地区光照相对充足,少光和无光照现象罕见。此外,各指标长期变化趋势空间差异显著,华北平原至长江中下游地区呈现明显增加态势。
(4)中国太阳能干旱事件呈现显著空间分异特征。四川盆地及云贵高原东部为极端干旱区,长江中下游地区为严重太阳能干旱区,华北平原为中度太阳能干旱区,东北东部地区为轻度太阳能干旱区,青藏高原-西北干旱区为微度太阳能干旱区。
综上所述,中国太阳能资源的时空不均衡性加剧,特别是在东部经济发达地区,太阳能干旱风险呈显著上升趋势,这对区域能源安全与农业生产构成了新的挑战,因此未来可结合卫星反演的太阳辐射产品对太阳能干旱进行精准监测,进一步提升空间分析精度。与此同时,太阳能干旱事件对光伏电站发电量、农业光合作用等实际应用场景的影响机制尚未深入探讨,后续研究可聚焦少光胁迫对能源生产、生态系统碳循环的量化影响,为气候资源管理与太阳能产业规划提供更精准的决策支持。
参考文献
“双碳”目标下我国电力部门低碳转型政策研究
[J].
Research on the low-carbon transition policies of power sector under the “Double Carbon” goal
[J].
Climate variability and global warming
[J].
A prediction of the monthly average daily solar radiation on a horizontal surface in Saudi Arabia using artificial neural network approach
[J].
DOI:10.3390/pr13041149
URL
[本文引用: 1]

When planning a solar energy conversion system, having sufficiently reliable values of the monthly average daily solar radiation (MADSR) on a horizontal surface is essential. Traditionally, estimates based on other climatological variables for which more information is available have been relied upon to compensate for the lack of direct solar radiation measurements. Solar radiation varies widely, which requires the creation of site-specific forecast models. By using artificial neural network (ANN) models or similar methods using historical datasets, the monthly average daily solar radiation can be easily assessed. To verify the validity of the established ANN model, a series of analyses was performed using the mean squared error, the coefficient of determination (R2), and the mean absolute error. The study used a dataset collected from nine weather stations in Saudi Arabia from 1985 to 2000. The input parameters for the ANN model were the maximum air relative humidity, latitude, the maximum ambient air temperature, longitude, the minimum ambient air temperature, the minimum air relative humidity, sunshine duration, location altitude, and the corresponding month. The R2 for the whole test dataset was 0.8449. Furthermore, a sensitivity analysis using the established ANN model showed that site elevation (location altitude) had the most significant effect on MADSR on a horizontal surface, with a contribution value of 14.66%. The analysis results show that the ANN model accurately estimates MADSR on horizontal surfaces regardless of seasonal variations in weather conditions. Furthermore, this work is important not only for its contribution to the shape of information in solar radiation forecasting but also for establishing the practical application of ANNs in renewable energy management. The results of this work will help improve the utilization of solar energy and support sustainable energy efforts. Furthermore, the proposed ANN model is believed to be useful for predicting MADSR on horizontal surfaces in other locations in Saudi Arabia with similar climatic conditions to the study sites. Furthermore, the ANN approach may be functional to the basic strategy of a solar arrangement and is suitable for forecasting other meteorological data.
City-level resilience to extreme weather shocks revealed by satellite nighttime lights in China
[J].DOI:10.1016/j.scs.2023.105167 URL [本文引用: 1]
Unraveling climate change-induced compound low-solar-low-wind extremes in China
[J].
Global solar droughts due to supply-demand imbalance exacerbated by anthropogenic climate change
[J].
A multi-decadal analysis of U.S. and Canadian wind and solar energy droughts
[J].
DOI:10.1063/5.0219648
URL
[本文引用: 1]
The spatial and temporal characteristics of wind and solar energy droughts across the contiguous U.S. and most of Canada for the period 1959–2022 are investigated using bias-corrected values of daily wind and solar power generation derived from the ERA5 meteorological reanalysis. The analysis domain has been divided into regions that correspond to four major interconnects and nine sub-regions. Droughts are examined for wind alone, solar alone, or a mix of wind and solar in which each provides 50% of the long-term mean energy produced, for durations of 1–90 days. Wind and solar energy droughts and floods are characterized on a regional basis through intensity–duration–frequency curves. Wind and solar generation are shown to be weakly anti-correlated over most of the analysis domain, with the exception of the southwest U.S. The intensities of wind and solar droughts are found to be strongly dependent on region. In addition, the wind resource in the central U.S. and the solar resource in the southwestern U.S. are sufficiently good that over-weighting capacity in those areas would help mitigate droughts that span the contiguous United States for most duration lengths. The correlation of droughts for the 50%–50% mix of wind and solar generation with temperature shows that the most intense droughts occur when temperatures exhibit relatively moderate values, not when energy demand will be largest. Finally, for all regions except the southeast U.S., winter droughts will have a larger impact on balancing the electric grid than summer droughts.
Seasonal compound renewable energy droughts in the Unites States
[J].
DOI:10.1088/2753-3751/adc8ad
[本文引用: 1]
Variable renewable energy (VRE) droughts are periods of low renewable electricity production due to natural variability in the weather and climate. These compound renewable energy droughts occur when two or more (typically wind and solar) generation sources are in low availability conditions at the same time. Compound wind and solar droughts are most commonly studied at the hourly and daily timescale due to the short-term nature of energy markets and battery storage capacity. However the seasonal time scale allows for the examination of broader climate and hydrologic patterns that influence a broader renewable energy portfolio and inform the needs for long-duration energy storage. In this study, we use a newly developed dataset of coincident renewable generation to characterize seasonal compound VRE droughts which include wind, solar and hydropower at grid-relevant spatial scales across the contiguous United States (US). Along with the frequency, duration, magnitude, and spatial scale, we specifically examine these climate patterns with a composite climate analysis. Results for the historical period (1982–2019) indicate that seasonal compound VRE droughts can last up to 5 months and occur most frequently in the Fall. While not an established ‘climate stress’ to consider in reliability studies yet, we demonstrate the impact of seasonal energy droughts on a resource adequacy study over the Western US interconnection using a nodal bulk power grid model. We further discuss how seasonal compound VREs can inform the sizing of long-duration energy storage and market incentives to manage short-term extreme events like heat waves and cold snaps while considering seasonal conditions.
Climate change impacts on the extreme power shortage events of wind-solar supply systems worldwide during 1980-2022
[J].
DOI:10.1038/s41467-024-48966-y
PMID:38890272
[本文引用: 1]
Economic productivity depends on reliable access to electricity, but the extreme shortage events of variable wind-solar systems may be strongly affected by climate change. Here, hourly reanalysis climatological data are leveraged to examine historical trends in defined extreme shortage events worldwide. We find uptrends in extreme shortage events regardless of their frequency, duration, and intensity since 1980. For instance, duration of extreme low-reliability events worldwide has increased by 4.1 hours (0.392 hours per year on average) between 1980-2000 and 2001-2022. However, such ascending trends are unevenly distributed worldwide, with a greater variability in low- and middle-latitude developing countries. This uptrend in extreme shortage events is driven by extremely low wind speed and solar radiation, particularly compound wind and solar drought, which however are strongly disproportionated. Only average 12.5% change in compound extremely low wind speed and solar radiation events may give rise to over 30% variability in extreme shortage events, despite a mere average 1.0% change in average wind speed and solar radiation. Our findings underline that wind-solar systems will probably suffer from weakened power security if such uptrends persist in a warmer future.© 2024. The Author(s).
The energy security risk assessment of inefficient wind and solar resources under carbon neutrality in China
[J].DOI:10.1016/j.apenergy.2024.122889 URL [本文引用: 1]
青海省日照时数的时空变化特征分析
[J].
Spatial and temporal variation characteristics of sunshine duration in Qinghai province
[J].
1961—2020年青藏高原日照时数时空演变特征
[J].
Temporal and spatial evolution characteristics of sunshine duration over Qinghai-Tibet Plateau from 1961 to 2020
[J].
A review of spatial resolution and regionalisation in national-scale energy systems optimisation models
[J].DOI:10.1016/j.esr.2021.100702 URL [本文引用: 1]
1980—2020年内蒙古暖季复合干旱热浪事件变化特征
[J].
DOI:10.13249/j.cnki.sgs.20230511
[本文引用: 1]
为了强化对复合干旱热浪事件(CDHEs)的监测,选择内蒙古作为研究区,基于115个站点数据,运用标准化降水蒸散指数和高温相对阈值法,对该区干旱和热浪事件进行定义与识别。并在此基础上,构建复合干旱热浪强度指数(CDHMI)进行复合干旱热浪频率(CDHF)统计,继而开展干旱、热浪和CDHEs时空变化特征研究。结果显示:暖季(5—10月)不同时间尺度(1个月和6个月尺度)干旱强度皆呈增加趋势。内蒙古西部和通辽市中部干旱频发,中东部地区干旱发生频率显著增加。热浪频率显著增加、热浪期显著延长,热浪持续时间和强度呈非显著增加趋势。热浪频率、持续时间和强度总体呈现西高东低的空间分布格局。CDHEs发生的频率和强度呈现显著增加趋势,特别是1998年之后。空间分布上,CDHF高值区集中在锡林郭勒盟和呼伦贝尔市,内蒙古北部地区CDHF明显增多,而高强度CDHMI分布在内蒙古东北和西南地区,增长趋势与CDHF相似。
Analysis of the variation characteristics of compound drought heatwave events during the warm season in Inner Mongolia from 1980 to 2020
[J].
CMIP6 对三峡库区万州段降水和气温的模拟能力评估
[J].
Evaluating the ability of CMIP6 models in simulating precipitation and temperature in Wanzhou city in the Three Gorges Reservoir
[J].
Application of the cross wavelet transform and wavelet coherence to geophysical time series
[J].
DOI:10.5194/npg-11-561-2004
URL
[本文引用: 1]
. Many scientists have made use of the wavelet method in analyzing time series, often using popular free software. However, at present there are no similar easy to use wavelet packages for analyzing two time series together. We discuss the cross wavelet transform and wavelet coherence for examining relationships in time frequency space between two time series. We demonstrate how phase angle statistics can be used to gain confidence in causal relationships and test mechanistic models of physical relationships between the time series. As an example of typical data where such analyses have proven useful, we apply the methods to the Arctic Oscillation index and the Baltic maximum sea ice extent record. Monte Carlo methods are used to assess the statistical significance against red noise backgrounds. A software package has been developed that allows users to perform the cross wavelet transform and wavelet coherence (www.pol.ac.uk/home/research/waveletcoherence/).
An analytical study on behavior of clusters using EM and K-means algorithm
[J].
近50年中国地面气候变化基本特征
[J].
Climate changes of China’s Mainland over the past half century
[J].
2003—2012年中国地表太阳辐射时空变化及其影响因子
[J].
Change analysis of surface solar radiation in China from 2003 to 2012
[J].
安徽省 50 年日照时数的变化特征及影响因素
[J].
DOI:10.11849/zrzyxb.2009.07.015
[本文引用: 1]
利用安徽省80站1955~2005年逐日日照时数、云量、水汽压、降水量及合肥市能见度资料,采用t检验、线性趋势分析等统计方法,分析了安徽省日照时数年、季节、月的变化特征以及空间分布特征;同时分析了可能影响日照时数的气象因子的变化特征。结果表明:安徽省年日照时数呈显著减少的趋势,平均美10年减少88.3h;除春季日照时数变化不明显外,其他季节日照时数显著减少。在20世纪60年代末至70年代初和70年代末都存在明显的突变,且都变少。安徽省日照时数大致呈纬向分布,分布形式为北高南低;除淮北市外,其它各站的日照时数均呈下降的趋势,其中下降趋势最大的是淮北的西部和江淮之间中部地区。能见度、大气水汽压、降水量、云量是影响日照时数的因素;日照时数的显著下降与能见度的下降、大气水汽压的增加、年降水量和年雨日数的增加关系密切,而与总云量和低云量的减少无关。
Climatic change of sunshine duration and its influencing factors over Anhui province during the last 50 years
[J].
青藏高原水循环中高原低涡及多季风交汇的研究进展
[J].
Advance of research on plateau vortex and multi-monsoon interaction in water cycle of Tibetan Plateau
[J].
中国陆地生态系统近30年NPP时空变化研究
[J].
Spatio-temporal variation analysis of ecological systems NPP in China in past 30 years
[J].
基于最大光能利用率动态校正的京津冀地区植被碳汇反演研究
[J].
Research on vegetation carbon sink inversion in Beijing-Tianjin-Hebei region based on dynamic correction of maximum light use efficiency
[J].
