

引言
亚洲中高纬区是气候变化敏感区,也是生态脆弱区。该区横跨温、寒两带,植被类型丰富多样,寒温带针叶林和草原分布广泛,陆地生态系统受降水和温度的影响显著,在维持区域碳平衡方面发挥着重要作用[15]。此外,亚洲中高纬区冻土覆盖面积较大,冻土中的碳库储量巨大,当温度升高时,冻土融化可能释放大量的温室气体,加剧气候变暖[16]。研究揭示,高纬度地区生态系统更易受气候和极端气候变化的影响[17-18]。近年来,亚洲中高纬区高温热浪事件频发且呈现加剧的趋势[19],但这种变化对生态系统的影响存在一定的不确定性。高温热浪的增多和加剧一方面会提高生态系统水分利用效率[20],促进植被生长[21-22],生态系统碳储量将更大[23]。如:2020年西伯利亚的持续高温导致总初级生产力(GPP)比2001—2019年平均值增加了10%[24],植被固定的总碳量增加。另一方面,高温热浪的发生会加剧野火风险,造成林木大面积死亡,使得植被生产力减少[25],导致气候变暖加剧。如:2010年俄罗斯的热浪打破了极端气温的纪录,导致GPP降低50%[26];一场发生于中国南方地区的严重热浪使碳汇在2个月内减少了46%[9]。可见,亚洲中高纬区生态系统的脆弱性与其碳储存价值并存,在气候/碳循环系统中起着重要的反馈作用[14]。
总而言之,全球变暖背景下高温热浪频发给亚洲中高纬区陆地生态系统带来巨大风险和不确定性[27]。暴露度(exposure)是人员、生计、环境服务和各种资源、基础设施,以及经济、社会和文化资产处在有可能受到不利影响的位置[28],可以为风险管理提供重要的理论依据。就高温热浪而言,目前大多数研究集中于高温热浪人口暴露度方面[29-30],但对陆地生态系统暴露度鲜少研究。本文以高温热浪日数作为热浪指标,基于8个CMIP6模式数据,分析未来亚洲中高纬区高温热浪及暴露于高温热浪下叶面积指数(LAI)、GPP和净初级生产力(NPP)的变化特征,并探讨影响亚洲中高纬区生态系统暴露度变化的各因子贡献,以期为亚洲中高纬区生态治理以及应对高温热浪风险提供参考依据。
1 数据与方法
1.1 数据
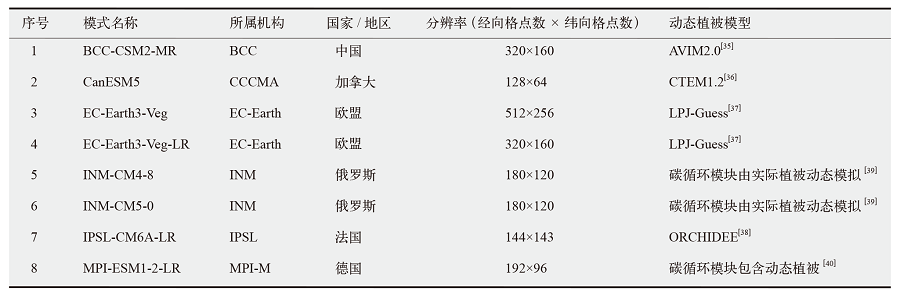
本文采用的模式资料为8个CMIP6模式历史试验(Historical,1850—2014年)和未来三种情景试验(SSP1-2.6、SSP2-4.5和SSP5-8.5,2015—2100年)下的日最高气温,逐月LAI、GPP和NPP数据。其中,SSP1-2.6情景到2100年辐射强迫稳定在约2.6 W/m2,代表低脆弱性、低减缓压力和低辐射强迫下的可持续发展情景;SSP2-4.5是中等辐射强迫情景,到2100年辐射强迫达到4.5 W/m2,代表中等社会脆弱性与中等辐射强迫下最接近当前社会经济和碳排放趋势的情景;SSP5-8.5情景到2100年人为辐射强迫达到8.5 W/m2,代表高辐射强迫下的不可持续发展情景[31]。
植被是陆地生态系统的主体。为综合评估高温热浪对生态系统的影响,本研究选取LAI、GPP和NPP作为研究指标,表征生态系统的结构和功能。LAI是单位土地面积上植物叶片总面积占土地面积的倍数[32],反映植被覆盖度和光合作用潜力;GPP代表植被通过光合作用固定的总碳量,直观反映生态系统的初级生产力水平;NPP则是GPP扣除植物自身呼吸消耗后的净碳积累量,是反映生态系统碳汇能力的重要指标[33]。模式对植被动态的模拟是影响其对生态系统模拟性能的重要因素之一[34]。因此,基于LAI,GPP和NPP数据的可获得性,本文选取CMIP6中8个模式开展研究。其中,BCC-CSM2-MR、CanESM5、IPSL-CM6A-LR以及EC-Earth3系列模式(EC-Earth3-Veg、EC-Earth3-Veg-LR)采用动态植被模型进行模拟,更新的积雪覆盖率和气溶胶等参数化方案,更好地反演了气候变化背景下植被叶片的生长和陆地生态系统碳储量[35
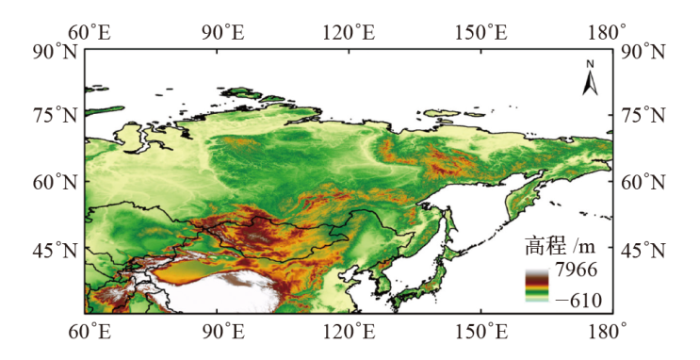
研究时段选取每年5—9月,该时段不仅热浪发生较多,也是植被的生长季。选取1995—2014年作为模式预估的参考时段,分别定义2021—2040年、2041—2060年和2081—2100年为21世纪近期、中期和末期。由于各模式间的分辨率不同,为了便于分析,采用双线性插值方法将所有模式数据插值到1°×1°网格上。亚洲中高纬区为35°N以北、60°E以东的亚洲地区(图1),主要包括西伯利亚、蒙古国、中国北方、朝鲜半岛、日本及中亚部分地区。
图1
1.2 方法
本研究通过相对阈值法[41]筛选高温热浪事件,当日最高气温连续3 d及以上均超过每日高温阈值时,则认为发生了一次高温热浪事件。以某日(f)为中心建立31 d的窗口(f-15到f+15之间),则数据集Af范围内日最高气温的第90个百分点为该日高温阈值。Af表示为
其中,U表示Ty,i的并集,Ty,i表示第y年第i天的日最高气温。
以高温热浪日数(HWD)为热浪指标,定义HWD与亚洲中高纬区陆地生态系统LAI、GPP、NPP的乘积为陆地生态系统(LAI、GPP、NPP)的暴露度。其变化可表示为:
式中:x表示HWD,y表示陆地生态系统(LAI、GPP、NPP);y∆x为气候因子作用,x∆y为生态因子作用,∆y∆x为非线性因子作用。三者的贡献分别为:
2 HWD模拟评估
在预估亚洲中高纬区HWD变化之前,我们首先基于美国国家海洋和大气管理局(NOAA)气候预测中心(CPC)全球日最高气温数据(视为观测)系统评估CMIP6模式对HWD的模拟性能。图2为1995—2014年观测和多模式集合(MME)模拟的亚洲中高纬区年平均HWD的气候态分布。观测结果显示:亚洲中高纬区HWD呈现明显的区域差异。高值区主要位于西西伯利亚、东西伯利亚南部、中亚、蒙古西部、中国的华北和新疆西部以及内蒙古中西部地区,年均HWD在7 d以上;低值区位于中国东北中部和新疆中东部、中西伯利亚和东西伯利亚部分地区,年均HWD不足4.8 d(图2a)。虽然存在一定程度上的高估和低估,但MME能较好地再现亚洲中高纬区西北部HWD偏多、东南部HWD偏少的分布特征(图2b)。
图2
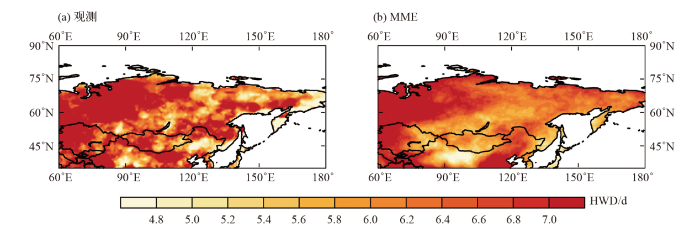
图2
观测(a)和MME模拟(b)的亚洲中高纬区1995—2014年平均HWD的气候态分布
Fig. 2
Climatological distribution of observed (a) and MME simulated (b) HWD during 1995-2014
为综合评估CMIP6模式的模拟性能,图3给出了CMIP6模拟HWD的泰勒图[42]。在泰勒图中,空间相关系数越大,均方根误差越小,标准方差比值越接近1,代表模拟结果越接近观测,模式模拟性能越好。图3显示,CMIP6中单模式模拟的高温热浪与观测结果的相关系数在0.13(INM-CM4-8)~0.32(BCC-CSM2-MR)之间,均方根误差大于1,标准方差比值基本在1左右。与单模式相比,MME能更合理地重现HWD的空间分布特征,其空间相关系数更高(0.5),均方根误差更小(1.1),方差比接近于1。相较于极端高温,高温热浪事件更多地考虑到异常高温的持续性和季节循环特征,给模式模拟带来更大的挑战[43]。
图3
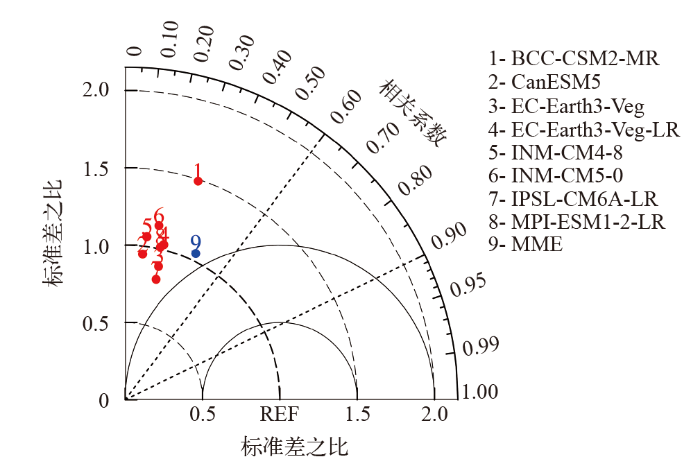
图3
CMIP6模式模拟1995—2014年亚洲中高纬区年平均HWD气候态空间分布的泰勒图
Fig. 3
Taylor diagram of CMIP6 models referring the climatological distribution of annual mean HWD over mid-high latitude Asia during 1995-2014
为进一步评估CMIP6模式对HWD整体变化趋势的模拟能力,图4给出了1995—2014年观测和CMIP6模式模拟的亚洲中高纬区年平均HWD距平百分率的时间变化。结果表明,观测的HWD整体呈明显增加趋势,趋势值为12.3%/(10 a)。CMIP6各模式模拟结果中,HWD均呈现增加趋势,趋势值范围在4.8%/(10 a)(IPSL-CM6A-LR)~17.9%/(10 a)(EC-Earth3-Veg-LR)。其中,MME模拟的亚洲中高纬区年平均HWD距平百分率序列与观测序列的相关系数为0.45,通过了0.05的显著性检验;MME模拟的趋势值为15.9%/(10 a),虽略有高估,但基本能够合理再现观测中HWD的增加趋势。
图4
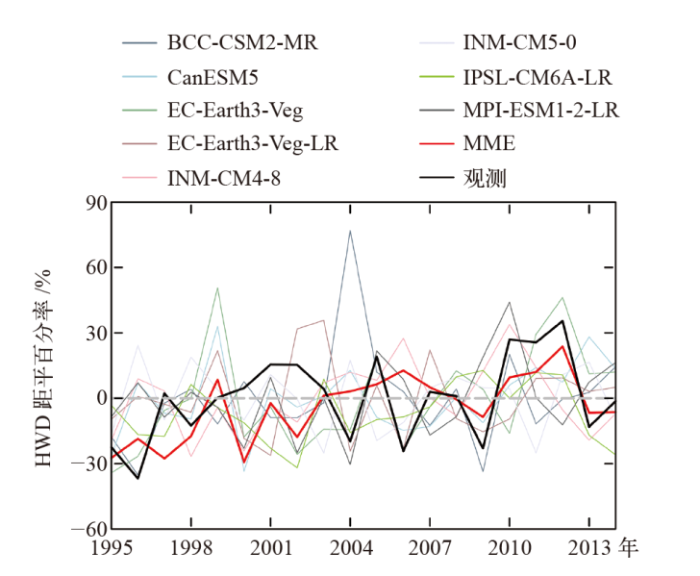
图4
1995—2014年观测和MME模拟的亚洲中高纬区年平均HWD距平百分率时间序列
Fig. 4
Time series of observed and MME simulated annual mean percentage of HWD anomaly over mid-high latitude Asia during 1995-2014
总的来说,相较于单个模式,MME对亚洲中高纬区HWD的模拟能力更好,能较好地再现亚洲中高纬区HWD的时空变化特征。此外,对CMIP6模拟亚洲生态系统的评估研究表明,上述模式对LAI、GPP和NPP也具有较好的模拟性能,且MME效果更佳[23]。因此,后文将采用MME模拟结果,分析未来亚洲中高纬区高温热浪及生态系统暴露度的变化。
3 HWD未来变化预估
图5给出了三种情景下亚洲中高纬区HWD随时间的变化。结果显示,未来亚洲中高纬区HWD整体呈上升趋势。其中,HWD在SSP5-8.5情景下的增幅最大,在SSP1-2.6情景下的增幅最小。相比1995—2014年,到21世纪末期,亚洲中高纬区HWD在SSP1-2.6、SSP2-4.5和SSP5-8.5情景下将分别增加12 d、30 d和74 d。
图5
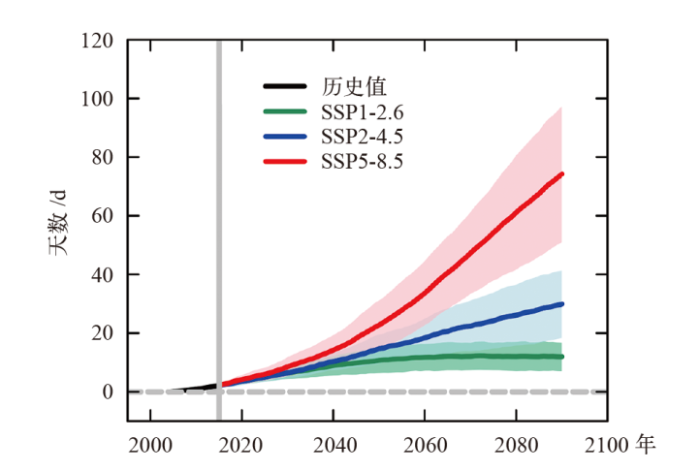
图5
SSP1-2.6、SSP2-4.5和SSP5-8.5情景下亚洲中高纬区区域平均的HWD变化(相对于1995—2014年,下同)
注:时间序列进行20 a滑动平均,阴影表示模式间±标准差范围。
Fig. 5
Temporal changes in HWD averaged over mid-high latitude Asian under SSP1-2.6, SSP2-4.5, and SSP5-8.5 (relative to 1995-2014, the same below). (Time series are smoothed with a 20-year running mean filter, and shadings represent the ranges of two standard deviations of model simulations)
三种情景下HWD在21世纪近期、中期和末期变化的空间分布如图6所示。可见,从21世纪近期到中期再到末期,亚洲中高纬区HWD均呈增加趋势,而且随着温室气体排放增多,HWD持续增加。具体来讲,在21世纪近期,三种情景下HWD变化的差异不大,大部分地区HWD将增加5~10 d(图6a, d, g);到21世纪中期,在SSP1-2.6(图6b)、SSP2-4.5(图6e)和SSP5-8.5(图6h)情景下,HWD将分别普遍增加5~10 d、10~15 d和15~20 d,其中勘察加半岛、中亚南部、中国新疆、韩国和日本等地区增加更为明显;到21世纪末期,HWD增加更为明显,尤其在SSP5-8.5情景下,HWD在整个亚洲中高纬区的增幅超过30 d(图6i)。
图6
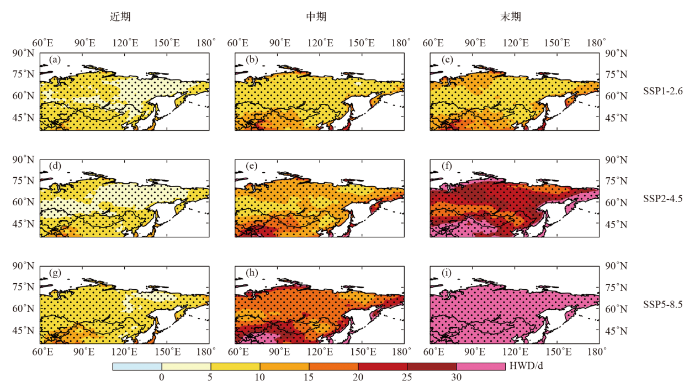
图6
MME预估的SSP1-2.6、SSP2-4.5和SSP5-8.5情景下到21世纪近期(2021—2040年)、中期(2041—2060年)和末期(2081—2100年)亚洲中高纬度地区的HWD变化
注:打点区域表示通过0.05的显著性检验。
Fig. 6
Spatial distribution of the MME projected changes in HWD during 2021-2040, 2041-2060, and 2081-2100 under SSP1-2.6, SSP2-4.5, and SSP5-8.5. (Areas with the changes above the 0.05 significance level are dotted)
4 生态系统暴露度变化预估
图7为三种情景下亚洲中高纬区陆地生态系统(LAI、GPP、NPP)暴露度的距平百分率随时间的变化。结果显示,未来整个亚洲中高纬区陆地生态系统对HWD的暴露度均呈一致的增加趋势,其中SSP5-8.5情景下增幅最为明显,SSP2-4.5情景次之,SSP1-2.6情景下的增幅最小。相较于LAI的暴露度,GPP和NPP暴露度的增幅更明显。与参考期(1995—2014年)相比,到21世纪末,LAI、GPP和NPP的暴露度在SSP1-2.6情景下将分别增加1.4倍、1.5倍和1.5倍(图7a);在SSP2-4.5情景下将分别增加3.9倍、4.5倍和4.4倍(图7b);在SSP5-8.5情景下将分别增加12.1倍、14.9倍和14.3倍(图7c)。从21世纪近期到末期,各情景下LAI、GPP和NPP暴露度的模式间不确定性均逐渐增大;尤其是SSP5-8.5情景下,生态系统暴露度的不确定性在21世纪中期后显著增加。这可能与HWD和LAI、GPP、NPP预估中的不确定性均随时间变化和排放强度的增加而增大有关[23]。预估结果中生态系统变化的不确定性也可能受不同模式间植被动态模拟方案差异的影响[32]。
图7
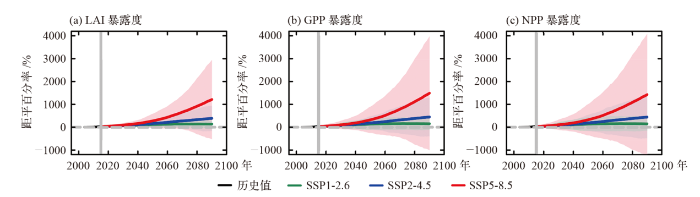
图7
三种情景下亚洲中高纬区陆地生态系统LAI暴露度(a)、GPP暴露度(b)和NPP暴露度(c)的距平百分率时间序列
注:时间序列进行20 a滑动平均,阴影表示模式间±标准差范围。
Fig. 7
Temporal changes in percentage anomalies of LAI exposure (a), GPP exposure (b), and NPP exposure (c) averaged over mid-high latitude Asia under three scenarios. (Time series are smoothed with a 20-year running mean filter, and shadings represent the ranges of two standard deviations of model simulations)
图8~10进一步给出了SSP1-2.6、SSP2-4.5和SSP5-8.5情景下LAI、GPP和NPP暴露度的距平百分率在21世纪近期、中期和末期的空间分布。从图中可以发现,未来不同时期暴露于高温热浪下的LAI、GPP和NPP在整个亚洲中高纬区均增加。相较于1995—2014年,在SSP1-2.6情景下,LAI暴露度在近极地、勘察加半岛、中国新疆、韩国和日本地区的增幅最大,且随着时间推移逐渐增加(图8a~c)。到21世纪末期,其增幅达2倍以上(图8c);SSP2-4.5情景下LAI暴露度的增幅范围进一步扩大,其中以勘察加半岛地区的增幅最大,其次为中国新疆、韩国、日本和中亚南部地区(图9a~c);在SSP5-8.5情景下,LAI暴露度的增幅最显著(图10a~c),在21世纪末期,大部分地区的LAI暴露度增幅超过9倍,增幅较小的中亚北部、中国的华北和东北等地区,增幅也在6倍以上(图10c)。
图8
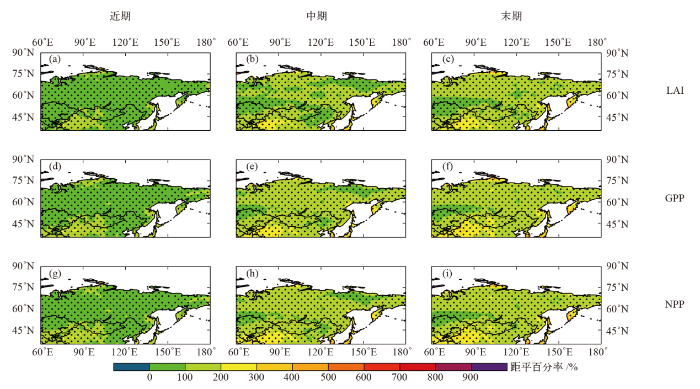
图8
MME预估的SSP1-2.6情景下到21世纪近期、中期和末期亚洲中高纬度地区LAI暴露度、GPP暴露度和NPP暴露度的距平百分率
注:打点区域表示通过0.05的显著性检验。
Fig. 8
Spatial distribution of the MME projected percentage anomalies of LAI exposure, GPP exposure, and NPP exposure during 2021-2040, 2041-2060, and 2081-2100 under SSP1-2.6. (Areas with the changes above the 0.05 significance level are dotted)
图9
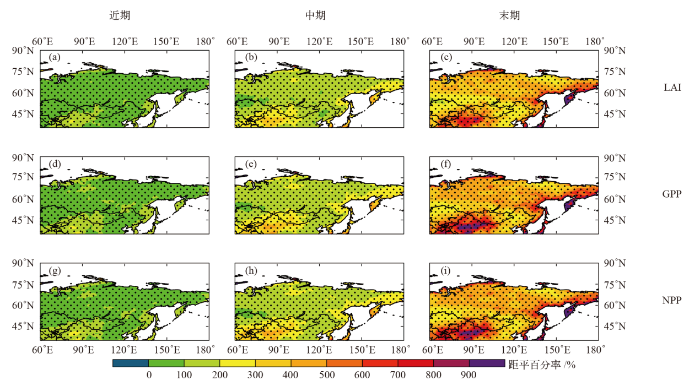
图9
同
注:打点区域表示通过0.05的显著性检验。
Fig. 9
Same as
图10
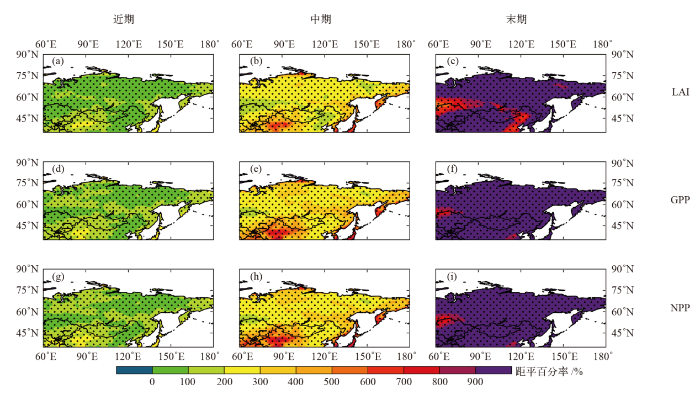
对GPP和NPP暴露度而言,在不同时期和情景下,其与LAI暴露度的变化在空间分布上高度一致,均在近极地、勘察加半岛、中国新疆、韩国和日本地区的增幅最大。具体来看,SSP1-2.6和SSP2-4.5情景下,亚洲中高纬区GPP和NPP暴露度均在21世纪近期普遍增加1倍左右(图8d, g和图9d, g),中期增加2倍左右(图8e, h和图9e, h);而到末期,SSP2-4.5情景下暴露度显著增加,增幅达到3倍以上(图9f, i)。在SSP5-8.5情景下,暴露于高温热浪下的GPP和NPP显著增加,特别是到21世纪末期,除中亚北部和中国华北部分地区增幅在7~9倍外,其他地区增幅普遍在9倍以上(图10f, i)。
图11为三种情景下21世纪近期、中期和末期影响亚洲中高纬区陆地生态系统LAI、GPP和NPP暴露度变化的各因子贡献。结果显示,在影响LAI、GPP和NPP暴露度变化的因子中,气候因子占主导作用,其次为非线性因子,生态因子的贡献最小。在21世纪近期,气候、生态和非线性因子各自对LAI暴露度变化的贡献率在三种情景下相差不大(图11a~c)。到中期,从SSP1-2.6到SSP5-8.5情景,气候和生态因子的贡献率逐渐减小,非线性因子的贡献率逐渐增大(图11a~c)。到末期,这种变化趋势更加明显。如,SSP5-8.5情景下气候和生态因子的贡献率分别由中期的0.76和0.06减少至0.64和0.03;而非线性因子的贡献率由中期的0.10增加到0.33(图11c)。对GPP和NPP暴露度而言,其与影响LAI暴露度的各因子变化基本一致,但变化幅度更大。到21世纪末期,随着温室气体排放增多,SSP5-8.5情景下气候因子对GPP和NPP暴露度变化的贡献率分别减少到0.52和0.56;生态因子的贡献率分别减少到0.04和0.04;而非线性因子的贡献率则分别增加至0.44和0.40(图11f和图11i)。
图11
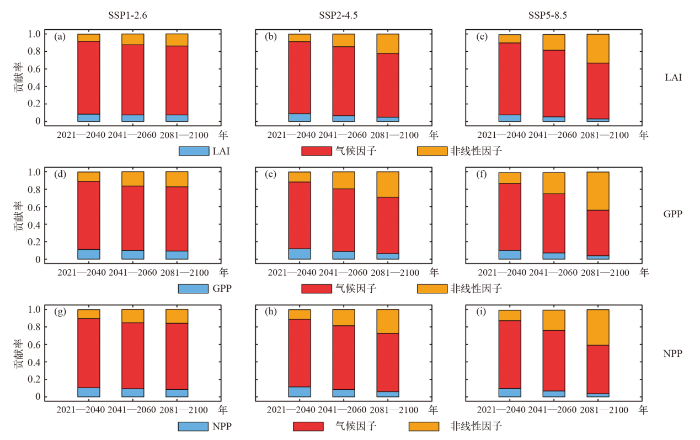
图11
三种情景下到21世纪近期、中期和末期时,气候因子、非线性因子和生态因子对亚洲中高纬度区LAI暴露度、GPP暴露度和NPP暴露度变化的贡献
Fig. 11
Contribution of climate factor, nonlinear interaction, and ecological factor to projected changes in LAI exposure, GPP exposure, and NPP exposure averaged over mid-high latitude Asia during 2021-2040, 2041-2060, and 2081-2100 under three scenarios
因此,在亚洲中高纬区,虽然气候因子是影响陆地生态系统暴露度变化的主导因子,但其作用随着时间推移在不断减弱;而非线性因子的贡献则在逐渐增强,尤其是在GPP和NPP暴露度的变化中;生态因子变化的影响较小。这说明未来亚洲中高纬区陆地生态系统受热浪影响将更倾向于气候和生态系统的综合作用,对陆地生态系统碳储量影响更大,需要我们重点关注。
5 结论与讨论
本文评估了8个CMIP6模式对亚洲中高纬区HWD的模拟性能,相较于单个模式,多模式集合平均(MME)能够更好地重现观测到的HWD空间分布特征和变化趋势。在此基础上,预估了SSP1-2.6、SSP2-4.5和SSP5-8.5情景下亚洲中高纬区HWD的变化特征;进一步地,根据前期研究中对上述CMIP6模式模拟亚洲中高纬区LAI、GPP、NPP的评估结果,分析了高温热浪下LAI、GPP、NPP暴露度变化及其影响因素的贡献。所得主要结论如下。
(1)未来HWD在整个亚洲中高纬区均呈增加趋势。相比参考期(1995—2014年),到21世纪末,HWD在SSP1-2.6、SSP2-4.5和SSP5-8.5情景下将分别增加12 d、30 d和74 d,增加最显著的区域位于勘察加半岛、中亚南部、中国新疆、韩国和日本地区。高排放情景下,21世纪末期整个亚洲中高纬区HWD增幅普遍超30 d。
(2)未来亚洲中高纬区暴露于高温热浪下的LAI、GPP和NPP明显增加,尤其是在SSP5-8.5情景下,与参考期(1995—2014年)相比,LAI、GPP和NPP暴露度到21世纪末将分别增加12.1倍、14.9倍和14.3倍。其中,高风险地区主要位于勘察加半岛、中亚南部、中国新疆、韩国和日本等地。到21世纪末期,在SSP5-8.5情景下,除中亚北部、中国华北和东北地区LAI、GPP和NPP暴露度的增幅相对较小外,亚洲中高纬区其他区域均普遍增加9倍以上。
(3)气候因子是影响LAI、GPP和NPP暴露度变化的主导因子,其次为非线性因子,生态因子的贡献最小。从21世纪近期到末期,随着温室气体排放增多,气候因子和生态因子的贡献逐渐减小,非线性因子的贡献则不断加大。在SSP5-8.5情景下,21世纪末期气候因子对LAI、GPP和NPP暴露度变化的贡献率分别为0.64、0.52和0.56;非线性因子贡献率分别为0.33、0.44和0.40;生态因子贡献率分别仅为0.03、0.04和0.04。
本文基于CMIP6模式预估了亚洲中高纬区高温热浪及相关的生态系统暴露度的变化,揭示了未来生态系统暴露于高温热浪的风险。本研究表明,在未来增暖的背景下,亚洲中高纬区高温热浪将持续增加,尤其在勘察加半岛、中亚、中国新疆、韩国和日本等地,而中亚北部、中国大部增幅较小。对未来生态系统暴露度的变化,气候因子的贡献最大,生态系统面临热浪的高风险区与热浪增幅较大的区域基本一致。在高排放情景下,随着时间推移,生态因子变化幅度加大,生态系统暴露度变化中生态因子和高温热浪的共同影响增强,由于西西伯利亚和中亚北部地区植被和其生产力的增幅相较于其他区域更小[23],该地区生态系统暴露于高温热浪的风险也相对略低。此外,研究表明,在RCP2.6情景下,极端高温事件对GPP的正面影响有望扩大,特别是在中国东北部和西伯利亚中西部地区,但在RCP8.5情景下正面影响的范围有所减少[44],这表明虽然亚洲中高纬区生态系统暴露于高温热浪的风险在不同排放情景下均有所增加,但不同排放强度下生态系统受高温热浪的实际影响可能存在差异。也就是说,陆地植被对于长期温度变化具有一定的适应性,生态系统通过调整物候和碳分配策略能够形成内在缓冲机制[45],但未来的潜在影响仍不确定。
总的来说,本研究结果可为亚洲中高纬区生态治理和应对高温热浪风险提供科学依据。针对高风险地区,建议提前制定针对性的生态保护策略,如加强植被保护和恢复,提升生态系统的韧性,促进区域生态系统的可持续发展。但本研究仍存在一定的局限性。如研究聚焦于生长季(5—9月)高温热浪的生态影响,而春季早期热浪可能通过激活物候进程促进碳吸收效率[46],不同季节的胁迫效应存在补偿机制[47],且植被类型差异也会导致极端温度响应的异质性[44],未来研究有必要针对不同季节尺度和植被类型深入分析高温热浪的生态效应。另外,虽然CMIP6模式中的碳循环模块得到较大改进,生态系统的预估结果仍存在较大不确定性,后续研究可通过偏差订正和降尺度等方法,进一步减少模式的系统误差,提高预估结果的可靠性。
参考文献
Accelerated exacerbation of global extreme heatwaves under warming scenarios
[J].
Projection of temperature and heat waves for Africa with an ensemble of CORDEX Regional Climate Models
[J].
Global heat stress on health, wildfires, and agricultural crops under different levels of climate warming
[J].
DOI:S0160-4120(18)32865-4
PMID:31048130
[本文引用: 1]

The effects of heat stress are spatially heterogeneous owing to local variations in climate response, population density, and social conditions. Using global climate and impact models from the Inter-Sectoral Impact Model Intercomparison Project, our analysis shows that the frequency and intensity of heat events increase, especially in tropical regions (geographic perspective) and developing countries (national perspective), even with global warming held to the 1.5 °C target. An additional 0.5 °C increase to the 2 °C warming target leads to >15% of global land area becoming exposed to levels of heat stress that affect human health; almost all countries in Europe will be subject to increased fire danger, with the duration of the fire season lasting 3.3 days longer; 106 countries are projected to experience an increase in the wheat production-damage index. Globally, about 38%, 50%, 46%, 36%, and 48% of the increases in exposure to health threats, wildfire, crop heat stress for soybeans, wheat, and maize could be avoided by constraining global warming to 1.5 °C rather than 2 °C. With high emissions, these impacts will continue to intensify over time, extending to almost all countries by the end of the 21st century: >95% of countries will face exposure to health-related heat stress, with India and Brazil ranked highest for integrated heat-stress exposure. The magnitude of the changes in fire season length and wildfire frequency are projected to increase substantially over 74% global land, with particularly strong effects in the United States, Canada, Brazil, China, Australia, and Russia. Our study should help facilitate climate policies that account for international variations in the heat-related threats posed by climate change.Copyright © 2019 The Authors. Published by Elsevier Ltd.. All rights reserved.
Changing feedbacks in the climate-biosphere system
[J].
Effects of climate extremes on the terrestrial carbon cycle: concepts, processes and potential future impacts
[J].
DOI:10.1111/gcb.12916
PMID:25752680
[本文引用: 1]
Extreme droughts, heat waves, frosts, precipitation, wind storms and other climate extremes may impact the structure, composition and functioning of terrestrial ecosystems, and thus carbon cycling and its feedbacks to the climate system. Yet, the interconnected avenues through which climate extremes drive ecological and physiological processes and alter the carbon balance are poorly understood. Here, we review the literature on carbon cycle relevant responses of ecosystems to extreme climatic events. Given that impacts of climate extremes are considered disturbances, we assume the respective general disturbance-induced mechanisms and processes to also operate in an extreme context. The paucity of well-defined studies currently renders a quantitative meta-analysis impossible, but permits us to develop a deductive framework for identifying the main mechanisms (and coupling thereof) through which climate extremes may act on the carbon cycle. We find that ecosystem responses can exceed the duration of the climate impacts via lagged effects on the carbon cycle. The expected regional impacts of future climate extremes will depend on changes in the probability and severity of their occurrence, on the compound effects and timing of different climate extremes, and on the vulnerability of each land-cover type modulated by management. Although processes and sensitivities differ among biomes, based on expert opinion, we expect forests to exhibit the largest net effect of extremes due to their large carbon pools and fluxes, potentially large indirect and lagged impacts, and long recovery time to regain previous stocks. At the global scale, we presume that droughts have the strongest and most widespread effects on terrestrial carbon cycling. Comparing impacts of climate extremes identified via remote sensing vs. ground-based observational case studies reveals that many regions in the (sub-)tropics are understudied. Hence, regional investigations are needed to allow a global upscaling of the impacts of climate extremes on global carbon-climate feedbacks. © 2015 The Authors. Global Change Biology published by John Wiley & Sons Ltd.
Modeling impacts of land uses on carbon and nitrogen contents, carbon dioxide and water effluxes of Mediterranean soils
[J].
1960—2018年中国高温热浪的线性趋势分析方法与变化趋势
[J].
Linear trend in occurrence of high temperature and heat waves in China for the 1960-2018 period: method and analysis results
[J].
Severe summer heatwave and drought strongly reduced carbon uptake in Southern China
[J].
Resilience of energy and CO2 exchange to a summer heatwave in an alpine humid grassland on the Qinghai-Tibetan Plateau
[J].
Leaf and ecosystem response to soil water availability in mountain grasslands
[J].
PMID:24465071
Climate change is expected to affect the Alps by increasing the frequency and intensity of summer drought events with negative impacts on ecosystem water resources. The response of CO and HO exchange of a mountain grassland to natural fluctuations of soil water content was evaluated during 2001-2009. In addition, the physiological performance of individual mountain forb and graminoid plant species under progressive soil water shortage was explored in a laboratory drought experiment. During the 9-year study period the natural occurrence of moderately to extremely dry periods did not lead to substantial reductions in net ecosystem CO exchange and evapotranspiration. Laboratory drought experiments confirmed that all the surveyed grassland plant species were insensitive to progressive soil drying until very low soil water contents (<0.01 m m) were reached after several days of drought. In field conditions, such a low threshold was never reached. Re-watering after a short-term drought event (5±1 days) resulted in a fast and complete recovery of the leaf CO and HO gas exchange of the investigated plant species. We conclude that the present-day frequency and intensity of dry periods does not substantially affect the functioning of the investigated grassland ecosystem. During dry periods the observed "water spending" strategy employed by the investigated mountain grassland species is expected to provide a cooling feedback on climate warming, but may have negative consequences for down-stream water users.
Climatic characteristics of heat waves and their simulation in plant experiments
[J].
Resistance and resilience of a grassland ecosystem to climate extremes
[J].
Impacts of droughts and extreme-temperature events on gross primary production and ecosystem respiration: a systematic assessment across ecosystems and climate zones
[J].
A large and persistent carbon sink in the world’s forests
[J].
Climate change and the permafrost carbon feedback
[J].
Modeling the dynamics of distribution, extent, and NPP of global terrestrial ecosystems in response to future climate change
[J].
Climatic control of the high-latitude vegetation greening trend and Pinatubo effect to cite this version: HAL Id: hal-01757611 climatic control of the high-latitude vegetation greening trend and pinatubo effect
[J].A biogeochemical model of vegetation using observed climate data predicts the high northern latitude greening trend over the past two decades observed by satellites and a marked setback in this trend after the Mount Pinatubo volcano eruption in 1991. The observed trend toward earlier spring budburst and increased maximum leaf area is produced by the model as a consequence of biogeochemical vegetation responses mainly to changes in temperature. The post-Pinatubo decline in vegetation in 1992-1993 is apparent as the effect of temporary cooling caused by the eruption. High-latitude CO(2) uptake during these years is predicted as a consequence of the differential response of heterotrophic respiration and net primary production.
Increasing trends in regional heatwaves
[J].
DOI:10.1038/s41467-020-16970-7
PMID:32620857
[本文引用: 1]
Heatwaves have increased in intensity, frequency and duration, with these trends projected to worsen under enhanced global warming. Understanding regional heatwave trends has critical implications for the biophysical and human systems they impact. Until now a comprehensive assessment of regional observed changes was hindered by the range of metrics employed, underpinning datasets, and time periods examined. Here, using the Berkeley Earth temperature dataset and key heatwave metrics, we systematically examine regional and global observed heatwave trends. In almost all regions, heatwave frequency demonstrates the most rapid and significant change. A measure of cumulative heat shows significant increases almost everywhere since the 1950s, mainly driven by heatwave days. Trends in heatwave frequency, duration and cumulative heat have accelerated since the 1950s, and due to the high influence of variability we recommend regional trends are assessed over multiple decades. Our results provide comparable regional observed heatwave trends, on spatial and temporal scales necessary for understanding impacts.
Variability of spring ecosystem water use efficiency in Northeast Asia and its linkage to the Polar-Eurasia pattern
[J].
Climate-driven increases in global terrestrial net primary production from 1982 to 1999
[J].Recent climatic changes have enhanced plant growth in northern mid-latitudes and high latitudes. However, a comprehensive analysis of the impact of global climatic changes on vegetation productivity has not before been expressed in the context of variable limiting factors to plant growth. We present a global investigation of vegetation responses to climatic changes by analyzing 18 years (1982 to 1999) of both climatic data and satellite observations of vegetation activity. Our results indicate that global changes in climate have eased several critical climatic constraints to plant growth, such that net primary production increased 6% (3.4 petagrams of carbon over 18 years) globally. The largest increase was in tropical ecosystems. Amazon rain forests accounted for 42% of the global increase in net primary production, owing mainly to decreased cloud cover and the resulting increase in solar radiation.
Greening of the Earth and its drivers
[J].
DOI:10.1038/NCLIMATE3004
[本文引用: 1]
Global environmental change is rapidly altering the dynamics of terrestrial vegetation, with consequences for the functioning of the Earth system and provision of ecosystem services(1,2). Yet how global vegetation is responding to the changing environment is not well established. Here we use three long-term satellite leaf area index (LAI) records and ten global ecosystem models to investigate four key drivers of LAI trends during 1982-2009. We show a persistent and widespread increase of growing season integrated LAI (greening) over 25% to 50% of the global vegetated area, whereas less than 4% of the globe shows decreasing LAI (browning). Factorial simulations with multiple global ecosystem models suggest that CO2 fertilization effects explain 70% of the observed greening trend, followed by nitrogen deposition (9%), climate change (8%) and land cover change (LCC) (4%). CO2 fertilization effects explain most of the greening trends in the tropics, whereas climate change resulted in greening of the high latitudes and the Tibetan Plateau. LCC contributed most to the regional greening observed in southeast China and the eastern United States. The regional effects of unexplained factors suggest that the next generation of ecosystem models will need to explore the impacts of forest demography, differences in regional management intensities for cropland and pastures, and other emerging productivity constraints such as phosphorus availability.
CMIP6模式对亚洲陆地生态系统的模拟评估与预估
[J].
CMIP6 evaluation and projection of terrestrial ecosystem over Asia
[J].
The 2020 heatwave led to a larger enhancement in annual gross primary production in West Siberia than in East Siberia
[J].
Climate extremes and climate change: the Russian heat wave and other climate extremes of 2010
[J].
Analysing the spatio-temporal impacts of the 2003 and 2010 extreme heatwaves on plant productivity in Europe
[J].
An ecological perspective on extreme climatic events: a synthetic definition and framework to guide future research
[J].
灾害风险的决定因素及其管理
[J].
Determinants of disaster risk and disaster risk management
[J].
Heatwave trends and the population exposure over China in the 21st century aswell as under 1.5℃ and 2.0℃ global warmer future scenarios
[J].
“一带一路”区域极端高温事件与人口暴露度特征
[J].
Spatial-temporal patterns of population exposed to the extreme maximum temperature events in the Belt and Road regions
[J].
CMIP6情景模式比较计划(ScenarioMIP)概况与评述
[J].
Short commentary on CMIP6 Scenario Model Intercomparison Project (ScenarioMIP)
[J].
An overview of global leaf area index (LAI): methods, products, validation, and applications
[J].
生物生产力的“4P”概念、估算及其相互关系
[J].
Implications and estimations of four terrestrial productivity parameters
[J].
Projected changes in terrestrial vegetation and carbon fluxes under 1.5℃ and 2.0℃ global warming
[J].
Development of land surface model BCC_AVIM2.0 and its preliminary performance in LS3MIP/CMIP6
[J].
The Canadian Earth System Model version 5 (CanESM5.0.3)
[J].The Canadian Earth System Model version 5 (CanESM5) is a global model developed to simulate historical climate change and variability, to make centennial-scale projections of future climate, and to produce initialized seasonal and decadal predictions. This paper describes the model components and their coupling, as well as various aspects of model development, including tuning, optimization, and a reproducibility strategy. We also document the stability of the model using a long control simulation, quantify the model's ability to reproduce large-scale features of the historical climate, and evaluate the response of the model to external forcing. CanESM5 is comprised of three-dimensional atmosphere (T63 spectral resolution equivalent roughly to 2.8 degrees) and ocean (nominally 1 degrees) general circulation models, a sea-ice model, a land surface scheme, and explicit land and ocean carbon cycle models. The model features relatively coarse resolution and high throughput, which facilitates the production of large ensembles. CanESM5 has a notably higher equilibrium climate sensitivity (5.6 K) than its predecessor, CanESM2 (3.7 K), which we briefly discuss, along with simulated changes over the historical period. CanESM5 simulations contribute to the Coupled Model Intercomparison Project phase 6 (CMIP6) and will be employed for climate science and service applications in Canada.
On the increased climate sensitivity in the EC-Earth model from CMIP5 to CMIP6
[J].
Simulation of the modern climate using the INM-CM48 climate model
[J].
Implementation of the CMIP6 forcing data in the IPSL-CM6A-LR model
[J].
Developments in the MPI-M Earth System Model version 1.2 (MPI-ESM1.2) and its response to increasing CO2
[J].
DOI:10.1029/2018MS001400
PMID:32742553
[本文引用: 1]
A new release of the Max Planck Institute for Meteorology Earth System Model version 1.2 (MPI-ESM1.2) is presented. The development focused on correcting errors in and improving the physical processes representation, as well as improving the computational performance, versatility, and overall user friendliness. In addition to new radiation and aerosol parameterizations of the atmosphere, several relatively large, but partly compensating, coding errors in the model's cloud, convection, and turbulence parameterizations were corrected. The representation of land processes was refined by introducing a multilayer soil hydrology scheme, extending the land biogeochemistry to include the nitrogen cycle, replacing the soil and litter decomposition model and improving the representation of wildfires. The ocean biogeochemistry now represents cyanobacteria prognostically in order to capture the response of nitrogen fixation to changing climate conditions and further includes improved detritus settling and numerous other refinements. As something new, in addition to limiting drift and minimizing certain biases, the instrumental record warming was explicitly taken into account during the tuning process. To this end, a very high climate sensitivity of around 7 K caused by low-level clouds in the tropics as found in an intermediate model version was addressed, as it was not deemed possible to match observed warming otherwise. As a result, the model has a climate sensitivity to a doubling of CO over preindustrial conditions of 2.77 K, maintaining the previously identified highly nonlinear global mean response to increasing CO forcing, which nonetheless can be represented by a simple two-layer model.©2019. The Authors.
Top ten European heatwaves since 1950 and their occurrence in the coming decades
[J].
Summarizing multiple aspects of model performance in a single diagram
[J].
CMIP6模式对亚洲中高纬区极端温度变化的模拟及预估
[J].
Assessment and projection of changes in temperature extremes over the mid-high latitudes of Asia based on CMIP6 models
[J].
Projected changes of ecosystem productivity and their responses to extreme heat events in northern Asia
[J].
Thermal optimality of net ecosystem exchange of carbon dioxide and underlying mechanisms
[J].
DOI:10.1111/j.1469-8137.2012.04095.x
PMID:22404566
[本文引用: 1]
• It is well established that individual organisms can acclimate and adapt to temperature to optimize their functioning. However, thermal optimization of ecosystems, as an assemblage of organisms, has not been examined at broad spatial and temporal scales. • Here, we compiled data from 169 globally distributed sites of eddy covariance and quantified the temperature response functions of net ecosystem exchange (NEE), an ecosystem-level property, to determine whether NEE shows thermal optimality and to explore the underlying mechanisms. • We found that the temperature response of NEE followed a peak curve, with the optimum temperature (corresponding to the maximum magnitude of NEE) being positively correlated with annual mean temperature over years and across sites. Shifts of the optimum temperature of NEE were mostly a result of temperature acclimation of gross primary productivity (upward shift of optimum temperature) rather than changes in the temperature sensitivity of ecosystem respiration. • Ecosystem-level thermal optimality is a newly revealed ecosystem property, presumably reflecting associated evolutionary adaptation of organisms within ecosystems, and has the potential to significantly regulate ecosystem-climate change feedbacks. The thermal optimality of NEE has implications for understanding fundamental properties of ecosystems in changing environments and benchmarking global models.© 2012 The Authors. New Phytologist © 2012 New Phytologist Trust.
Whole-system responses of experimental plant communities to climate extremes imposed in different seasons
[J].
DOI:10.1111/j.1469-8137.2010.03515.x
PMID:21054412
[本文引用: 1]
• Discrete climate events such as heat waves and droughts can have a disproportionate impact on ecosystems relative to the temporal scale over which they occur. Research oriented towards (extreme) events rather than (gradual) trends is therefore urgently needed. • Here, we imposed heat waves and droughts (50-yr return time) in a full factorial design on experimental plant communities in spring, summer or autumn. Droughts were created by removing the controlled water table (rainout shelters prevented precipitation), while heat waves were imposed with infrared heaters. • Measurements of whole-system CO(2) exchange, growth and biomass production revealed multiple interactions between treatments and the season in which they occurred. Heat waves had only small and transient effects, with infrared imaging showing little heat stress because of transpirational cooling. If heat waves were combined with drought, negative effects observed in single factor drought treatments were exacerbated through intensified soil drying, and heat stress in summer. Plant recovery from stress differed, affecting the biomass yield. • In conclusion, the timing of extreme events is critical regarding their impact, and synergisms between heat waves and drought aggravate the negative effects of these extremes on plant growth and functioning.© 2010 The Authors. New Phytologist © 2010 New Phytologist Trust.
Earlier springs decrease peak summer productivity in North American boreal forests
[J].
