Climate Change Research ›› 2023, Vol. 19 ›› Issue (5): 667-671.doi: 10.12006/j.issn.1673-1719.2023.149
Previous Articles Next Articles
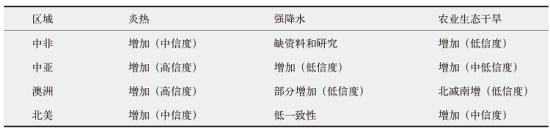
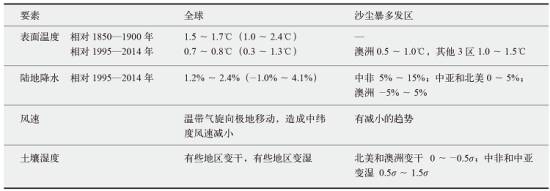
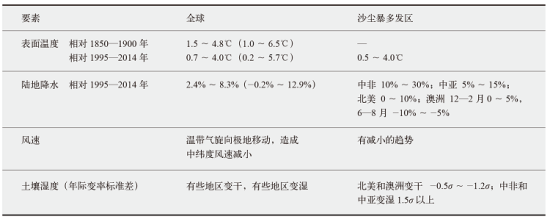
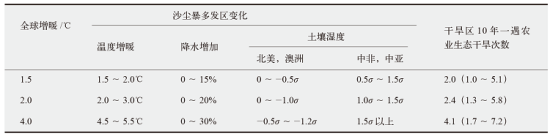
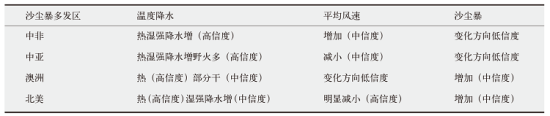
Global warming and sand-dust storms
|
|
Climate Change Research ›› 2023, Vol. 19 ›› Issue (5): 667-671.doi: 10.12006/j.issn.1673-1719.2023.149
Previous Articles Next Articles
|