气候变化研究进展 ›› 2023, Vol. 19 ›› Issue (5): 592-604.doi: 10.12006/j.issn.1673-1719.2023.088
2001—2020年中国月尺度热带气旋灾害时空变化特征研究
赵珊珊1,2( ), 李莹1,2(), 赵大军3, 周星妍1,2, 艾婉秀1,2
- 1 中国气象局气候预测研究重点开放实验室,国家气候中心,北京 100081
2 国家气候中心,北京 100081
3 中国气象科学研究院灾害天气国家重点实验室,北京 100081
-
收稿日期:2023-04-23修回日期:2023-06-27出版日期:2023-09-30发布日期:2023-08-29 -
通讯作者:李莹,女,高级工程师,yingli@cma.gov.cn -
作者简介:赵珊珊,女,正研级高级工程师,zhaoss@cma.gov.cn -
基金资助:国家自然科学基金项目(42005029);国家自然科学基金项目(41875120);上海台风研究基金项目(TFJJ202201);国家重点研发项目(2018YFC1509007)
Spatio-temporal characteristics of tropical cyclone disaster on monthly scale over China during 2001-2020
ZHAO Shan-Shan1,2(), LI Ying1,2(), ZHAO Da-Jun3, ZHOU Xing-Yan1,2, AI Wan-Xiu1,2
- 1 China Meteorological Administration Key Laboratory for Climate Prediction Studies, National Climate Center, Beijing 100081, China
2 National Climate Centre, China Meteorological Administration, Beijing 100081, China
3 State Key Laboratory of Severe Weather, Chinese Academy of Meteorological Sciences, Beijing 100081, China
-
Received:2023-04-23Revised:2023-06-27Online:2023-09-30Published:2023-08-29
摘要:
在全球变暖背景下,西北太平洋和南海热带气旋(TC)移动路径发生了明显变化。中国社会经济迅速发展导致承灾体暴露度增加,中国TC灾害的时空分布呈现新的特征。利用2001—2020年中国省级TC灾害损失资料,对比分析了前后10年中国月尺度TC灾害的时空分布特征。结果表明:中国7—9月的TC灾害损失占全年总损失的84%以上,大部分省(区、市)TC灾害损失峰值出现在8月,但广西峰值出现在7月,海南、内蒙古和黑龙江出现在9月;中国致灾TC(DTC)中有15%未登陆中国,未登陆DTC在海南发生频次最高,在黑龙江造成的损失最重;与2001—2010年相比,2011—2020年中国DTC年频数增加,其中未登陆DTC年频数增加,登陆DTC年频数减少,但8月登陆和未登陆DTC频数均增加;受西北太平洋和南海TC活动路径变化的影响,2011—2020年中国8月DTC灾害损失更突出,未登陆DTC影响增大,DTC影响范围向北扩展,给中国TC灾害预报预警和防台减灾工作带来更严峻的挑战。
引用本文
赵珊珊, 李莹, 赵大军, 周星妍, 艾婉秀. 2001—2020年中国月尺度热带气旋灾害时空变化特征研究[J]. 气候变化研究进展, 2023, 19(5): 592-604.
ZHAO Shan-Shan, LI Ying, ZHAO Da-Jun, ZHOU Xing-Yan, AI Wan-Xiu. Spatio-temporal characteristics of tropical cyclone disaster on monthly scale over China during 2001-2020[J]. Climate Change Research, 2023, 19(5): 592-604.
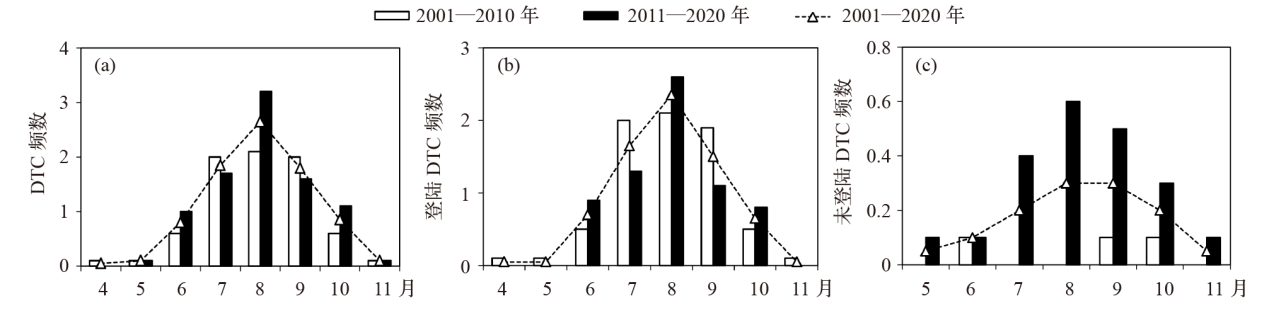
图1 2001—2020年致灾气旋(DTC)(a)、登陆DTC (b)和未登陆DTC (c)年平均频数的逐月分布
Fig. 1 Monthly distribution of annual frequency of disastrous tropical cyclone (DTC) (a), landfalling DTC (b), and non-landfalling DTC (c) during 2001-2020

图2 2001—2020年DTC和未登陆DTC灾害损失的逐月分布(a~b)受灾人口,(c~d)受灾面积,(e~f)直接经济损失
Fig. 2 Monthly distribution of disaster losses of DTC and non-landfalling DTC during 2001-2020. (a, b) Affected population, (c, d) affected crop area, (e, f) direct economic losses
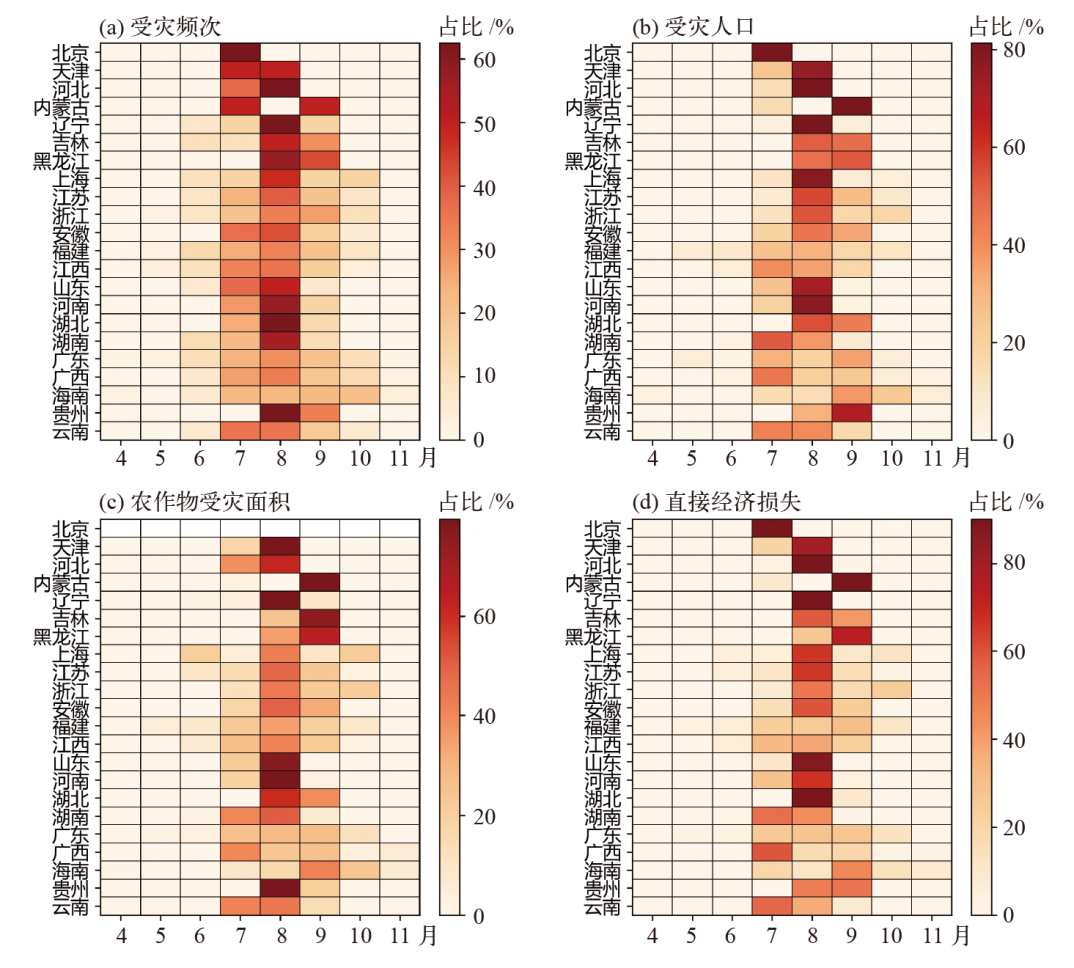
图3 2001—2020年DTC受灾频次(a) 和灾害损失(b~d)各月占比的分布
Fig. 3 Distribution of monthly percentage of frequency of DTC (a) and TC-disaster losses (b-d) to the annual total during 2001-2020
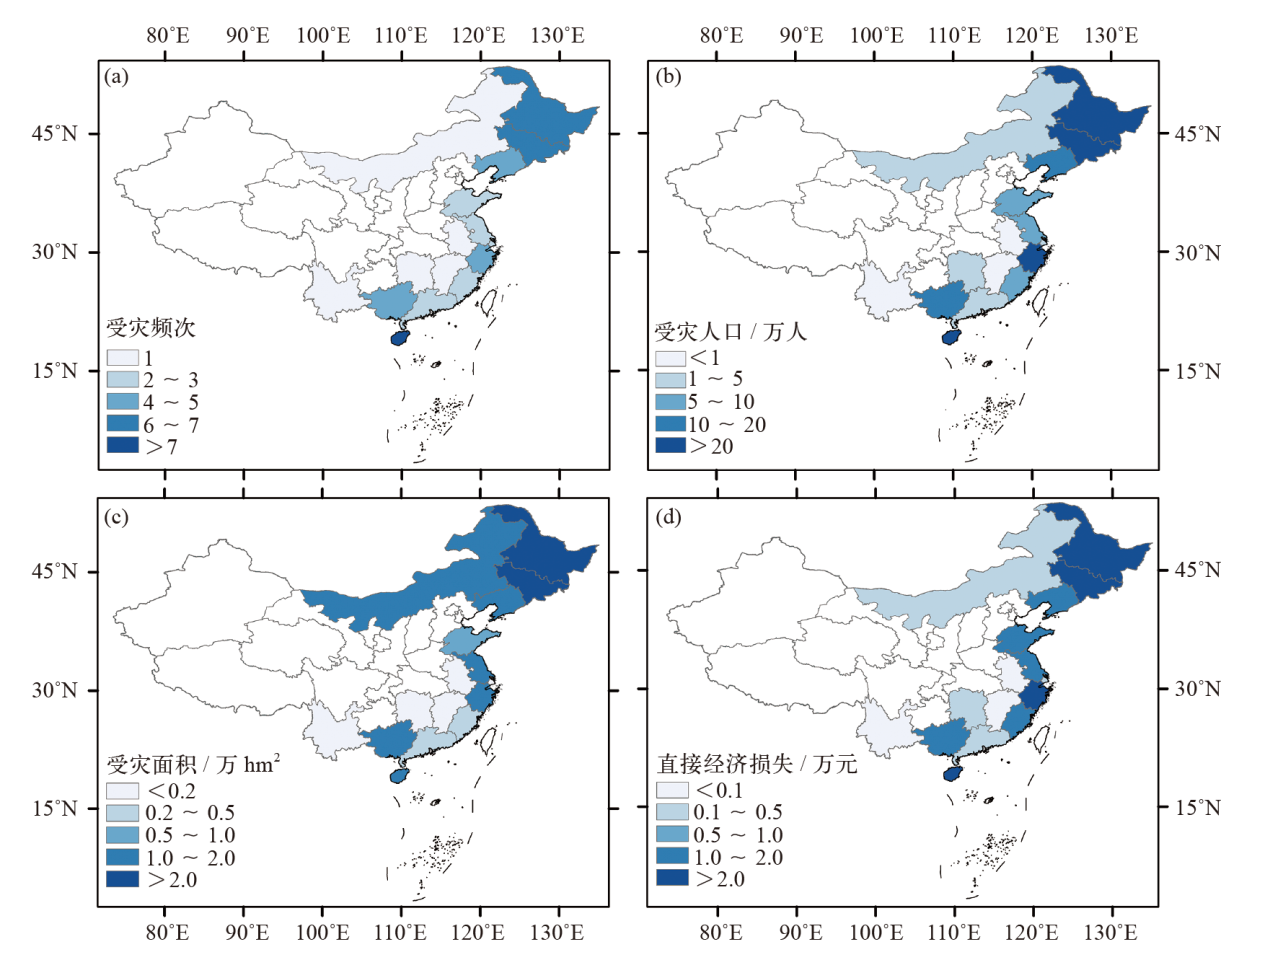
图4 2001—2020年未登陆DTC总频次(a)和多年平均灾害损失(b~d)的空间分布
Fig. 4 Spatial distribution of total frequency (a) and annual mean disaster losses (b-d) of non-landfalling DTC during 2001-2020

图5 中国7—9月DTC受灾频次、受灾人口、受灾面积和直接经济损失前后10年差值空间分布
Fig. 5 Spatial distribution of the difference of annual mean DTC frequency, affected population, affected crop area and direct economic losses over China during July-September between 2011-2020 and 2001-2010
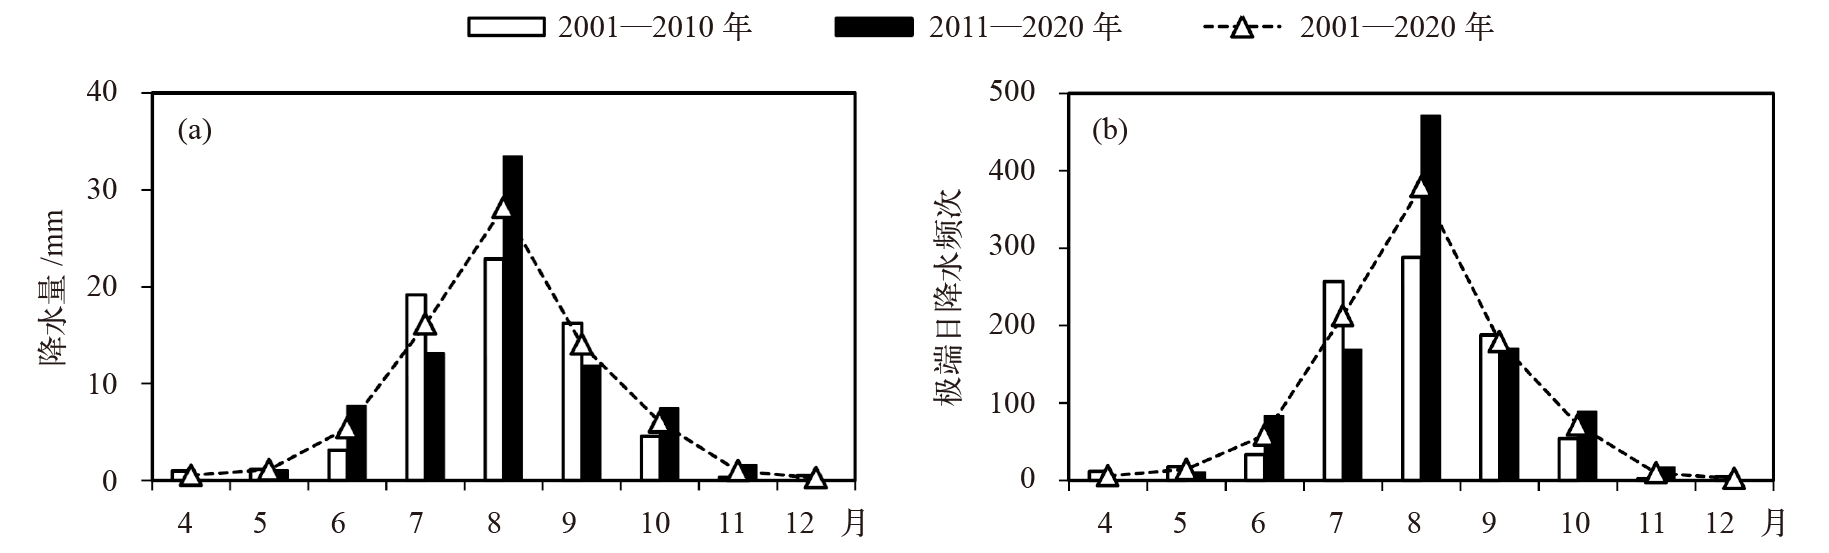
图6 2001—2020年平均TC降水量(a)和极端日降水频次(b)的逐月分布
Fig. 6 Monthly distribution of mean TC precipitation (a) and frequency of extreme TC daily precipitation events (b) during 2001-2020
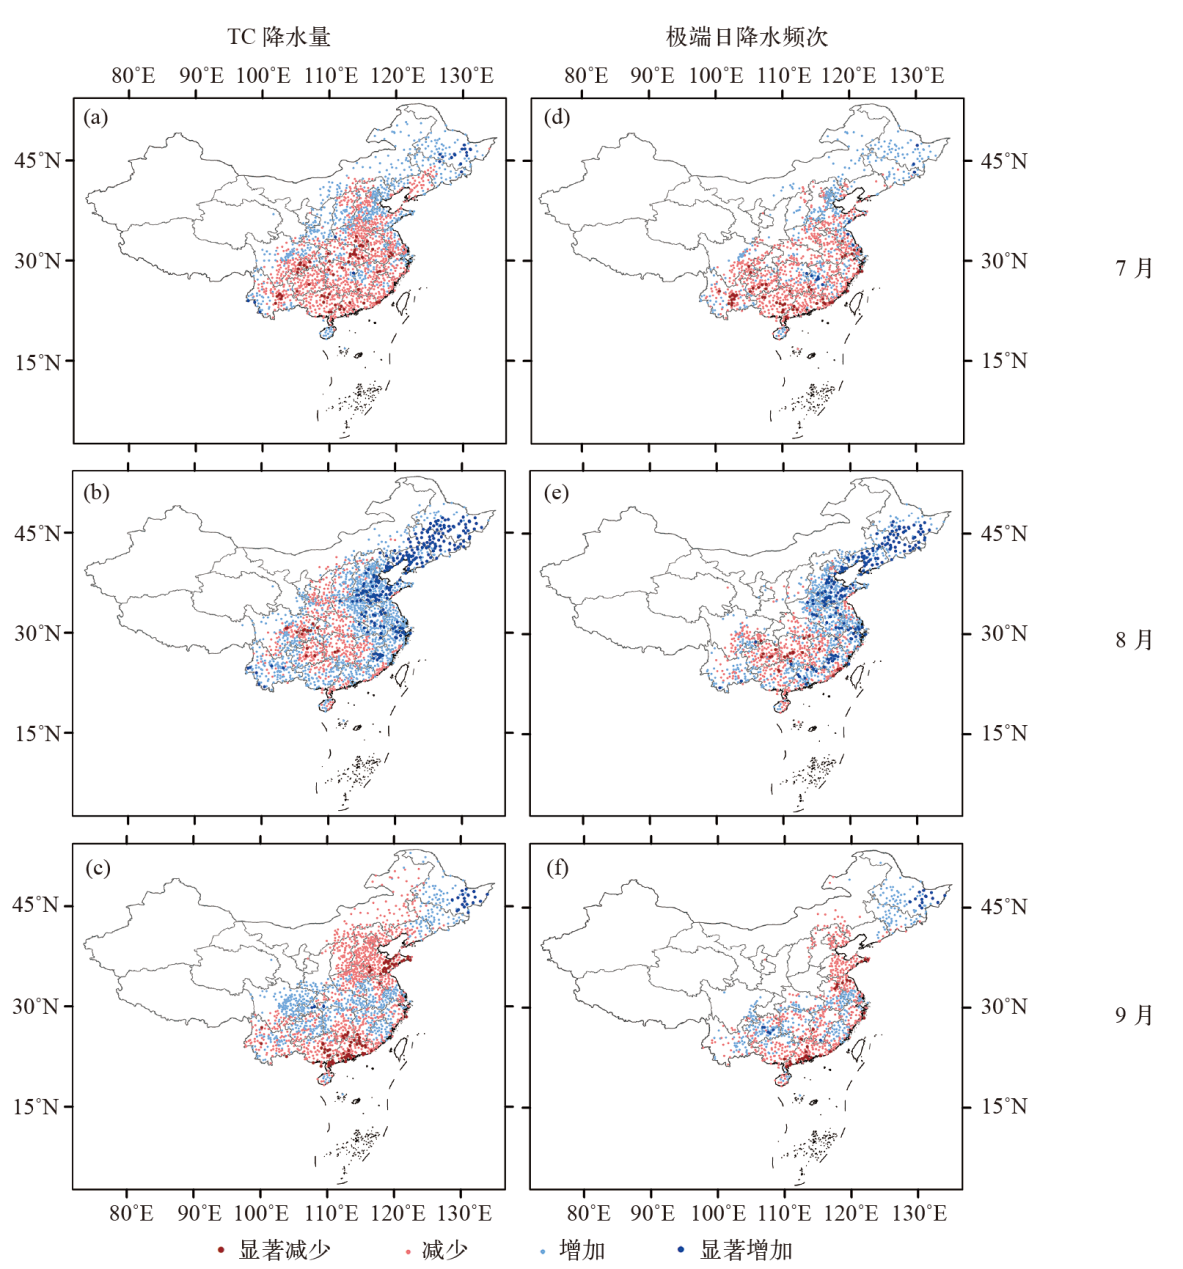
图7 7—9月各月TC降水量和极端日降水频次前后10年差值空间分布 注:图中显著性水平为0.10。
Fig. 7 Spatial distribution of difference of annual mean TC precipitation and frequency of extreme TC daily precipitation events during July-September between 2011-2020 and 2001-2010. (The significance level is 0.1)
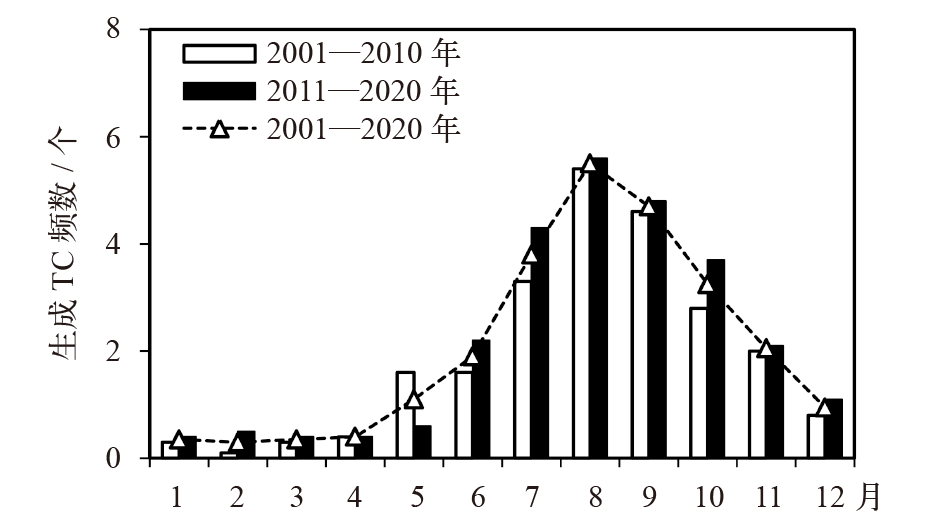
图8 2001—2020年多年平均西北太平洋和南海生成TC频数的逐月分布
Fig. 8 Monthly distribution of annual mean occurrence of TCs from western North Pacific and the South China Sea during 2001-2020

图9 2011—2020年与2001—2010年西北太平洋和南海生成TC的路径密度差值分布 注:黑点代表差值通过0.10显著性水平的检验。
Fig. 9 Spatial distribution of the difference of TC tracks from Northwest Pacific and the South China Sea between 2011-2020 and 2001-2010. (Black dot denotes the difference is significant at the significance level of 0.1)
| [1] | 杨玉华, 应明, 陈葆德. 近58年来登陆中国热带气旋气候变化特征[J]. 气象学报, 2009, 67 (5): 689-696. |
| Yang Y H, Ying M, Chen B D. The climatic changes of landfall tropical cyclones in China over the past 58 years[J]. Acta Meteorologica Sinica, 2009, 67 (5): 689-696 (in Chinese) | |
| [2] | 赵珊珊, 任福民, 高歌, 等. 近十年我国热带气旋灾害的特征研究[J]. 热带气象学报, 2015, 31 (3): 424-432. |
| Zhao S S, Ren F M, Gao G, et al. Characteristics of Chinese tropical cyclone disaster in the past 10 years[J]. Journal of Tropical Meteorology, 2015, 3 (13): 424-432 (in Chinese) | |
| [3] |
Li Y, Zhao S S, Wang G F. Spatiotemporal variations in meteorological disasters and vulnerability in China during 2001-2020[J]. Frontiers in Earth Science, 2021, 9: 789523
doi: 10.3389/feart.2021.789523 URL |
| [4] | 陈敏, 郑永光, 陶祖钰. 近50年(1949—1996)西北太平洋热带气旋气候特征的再分析[J]. 热带气象学报, 1999, 15 (1): 10-16. |
| Chen M, Zheng Y G, Tao Z Y. An analysis on tropical cyclones’ climatic feature in the Western North Pacific for 1949-1996[J]. Journal of Tropical Meteorology, 1999, 15 (1): 10-16 (in Chinese) | |
| [5] | 高歌, 黄大鹏, 赵珊珊. 基于信息扩散方法的中国TC灾害年月尺度风险评估[J]. 气象, 2019, 45 (11): 1600-1610. |
| Gao G, Huang D P, Zhao S S. Annual and monthly risk assessment of typhoon disasters in China based on the information diffusion method[J]. Meteorological Monthly, 2019, 45 (11): 1600-1610 (in Chinese) | |
| [6] | 卢莹, 赵海坤, 赵丹, 等. 1984—2017年影响中国热带气旋灾害的时空特征分析[J]. 海洋学报, 2021, 43 (6): 45-61. |
| Lu Y, Zhao H K, Zhao D, et al. Spatial-temporal characteristic of tropical cyclone disasters in China during 1984-2017[J]. Haiyang Xuebao, 2021, 43 (6): 45-61 (in Chinese) | |
| [7] | 雷小途, 陈佩燕, 杨玉华, 等. 中国台风灾情特征及其灾害客观评估方法[J]. 气象学报, 2009, 67 (5): 875-883. |
| Lei X T, Chen P Y, Yang Y H, et al. Characters and objective assessment of disasters caused by typhoons in China[J]. Acta Meteorologica Sinica, 2009, 67 (5): 875-883 (in Chinese) | |
| [8] |
Zhang Q, Wu L G, Liu Q F. Tropical cyclone damages in China 1983-2006[J]. Bulletin of the American Meteorological Society, 2009, 90 (4): 489-496
doi: 10.1175/2008BAMS2631.1 URL |
| [9] | 温姗姗, 翟建青, Fischer T, 等. 1984—2014年影响中国热带气旋的经济损失标准化及其变化特征[J]. 热带气象学报, 2017, 33 (4): 478-487. |
| Wen S S, Zhai J Q, Fischer T, et al. Vaiation of normalized economic losses from influential tropical cyclones in China for 1984-2014[J]. Journal of Tropical Meteorology, 2017, 33 (4): 478-487 (in Chinese) | |
| [10] |
Knutson T R, Camargo S J, Chan J, et al. Tropical cyclones and climate change[J]. Nature Geoscience, 2010, 3 (3): 157-163
doi: 10.1038/ngeo779 URL |
| [11] | Zhang W, Vecchi G A, Murakami H, et al. Influences of natural variability and anthropogenic forcing on the extreme 2015 accumulated cyclone energy in the Western North Pacific[J]. Bulletin of the American Meteorological Society, 2016, 97 (12): 131-135 |
| [12] |
Studholme J, Fedorov A V, Gulev S K, et al. Poleward expansion of tropical cyclone latitudes in warming climates[J]. Nature Geoscience, 2022, 15: 14-28
doi: 10.1038/s41561-021-00859-1 URL |
| [13] | Kossin J P, Emanuel K A, Camargo S J. Past and projected changes in Western North Pacific tropical cyclone exposure[J]. Journal of Climate, 2016: 5725-5739 |
| [14] |
Li R C, Zhou W, Shun C, et al. Change in destructiveness of landfalling tropical cyclones over China in recent decades[J]. Journal of Climate, 2017, 30 (9): 3367-3379
doi: 10.1175/JCLI-D-16-0258.1 URL |
| [15] | 任福民, 吴国雄, 王小玲, 等. 近60年影响中国之热带气旋[M]. 北京: 气象出版社, 2011: 43-74. |
| Ren F M, Wu G X, Wang X L, et al. Tropical cyclones affecting China over the last 60 years[M]. Beijing: China Meteorological Press, 2011: 43-74 (in Chinese) | |
| [16] |
Wang Y J, Wen S S, Li X C, et al. Spatiotemporal distributions of influential tropical cyclones and associated economic losses in China in 1984-2015[J]. Natural Hazards, 2016, 84: 2009-2030
doi: 10.1007/s11069-016-2531-6 URL |
| [17] |
Liu L, Wang Y, Zhan R, et al. Increasing destructive potential of landfalling tropical cyclones over China[J]. Journal of Climate, 2020, 33 (9): 3731-3743
doi: 10.1175/JCLI-D-19-0451.1 URL |
| [18] |
Chen J L, Tam C, Cheung K, et al. Changing impacts of tropical cyclones on East and Southeast Asian inland regions in the past and a globally warmed future climate[J]. Frontiers in Earth Science, 2021, 9: 769005
doi: 10.3389/feart.2021.769005 URL |
| [19] | 胡娅敏, 宋丽莉. 登陆中国热带气旋台风季参数的气候特征分析[J]. 气候变化研究进展, 2009, 5 (2): 90-94. |
| Hu Y M, Song L L. Climatologically statistical features of typhoon season parameters of tropical cyclones landfalling in China[J]. Climate Change Research, 2009, 5 (2): 90-94 (in Chinese) | |
| [20] | Li Y, Zhao S, Zhao D, et al. Changes in tropical cyclone disasters over China during 2001-2020[J]. Earth and Space Science, 2023, 10: E2022EA002795 |
| [21] |
Wang H, Xu M, Onyejuruwa A, et al. Tropical cyclone damages in Mainland China over 2005-2016: losses analysis and implications[J]. Environment, Development and Sustainability, 2019, 21 (6): 3077-3092
doi: 10.1007/s10668-019-00481-7 URL |
| [22] | 张娇艳, 吴立广, 张强. 全球变暖背景下我国热带气旋灾害趋势分析[J]. 热带气象学报, 2011, 27 (4): 442-454. |
| Zhang J Y, Wu L G, Zhang Q. Tropical cyclone damages in China under the background of global warming[J]. Journal of Tropical Meteorology, 2011, 27 (4): 442-454 | |
| [23] | 赵珊珊, 高歌, 黄大鹏, 等. 2004—2013年中国气象灾害损失特征分析[J]. 气象与环境学报, 2017, 33 (1): 101-107. |
| Zhao S S, Gao G, Huang D P, et al. Characteristics of meteorological disaster losses in China from 2004 to 2013[J]. Journal of Meteorology and Environment, 2017, 33 (1): 101-107 (in Chinese) | |
| [24] |
Lu X, Yu H, Ying M, et al. Western North Pacific tropical cyclone database created by the China Meteorological Administration[J]. Advances in Atmospheric Sciences, 2021, 38 (4): 690-699
doi: 10.1007/s00376-020-0211-7 URL |
| [25] | 曹丽娟, 严中伟. 地面气候资料均一性研究进展[J]. 气候变化研究进展, 2011, 7 (2): 129-135. |
| Cao L J, Yan Z W. Progresses in research of homogenization of climate data[J]. Climate Change Research, 2011, 7 (2): 129-135 (in Chinese) | |
| [26] |
Ren F M, Wang Y M, Wang X L, et al. Estimating tropical cyclone precipitation from station observations[J]. Advances in Atmospheric Sciences, 2007, 24: 700-711
doi: 10.1007/s00376-007-0700-y URL |
| [27] |
Feng T, Ren F, Zhang D L, et al. Sideswiping tropical cyclones and their associated precipitation over China[J]. Advances in Atmospheric Science, 2020, 37: 707-717
doi: 10.1007/s00376-020-9224-5 URL |
| [28] |
Wen S, Su B, Wang Y, et al. Economic sector loss from influential tropical cyclones and relationship to associated rainfall and wind speed in China[J]. Global and Planetary Change, 2018, 169: 224-233
doi: 10.1016/j.gloplacha.2018.08.004 URL |
| [29] |
Zhao D, Gao W, Xu H, et al. A modeling study of cloud physical properties of extreme and non-extreme precipitation in landfalling typhoons over China[J]. Atmospheric Research, 2022, 277: 106311
doi: 10.1016/j.atmosres.2022.106311 URL |
| [30] |
Yu Z, Wang Y, Xu H, et al. On the relationship between intensity and rainfall distribution in tropical cyclones making landfall over China[J]. Journal of Applied Meteorology and Climatology, 2017, 56: 2883-2901
doi: 10.1175/JAMC-D-16-0334.1 URL |
| [31] |
Son J H, Kwon J I, Heo K Y. Weak upstream westerly wind attracts Western North Pacific typhoon tracks to west[J]. Environmental Research Letters, 2021, 16: 124041
doi: 10.1088/1748-9326/ac3aa4 URL |
| [1] | 聂心宇, 谭红建, 蔡榕硕, 高学杰. 利用区域气候模式预估未来登陆中国热带气旋活动[J]. 气候变化研究进展, 2023, 19(1): 23-37. |
| [2] | 王毅, 杨舒楠, 张立生, 曹勇, 尹宜舟. 三个全球气象灾害数据库对比及展望[J]. 气候变化研究进展, 2022, 18(2): 253-260. |
| [3] | 李莹, 赵珊珊. 2001—2020年中国洪涝灾害损失与致灾危险性研究[J]. 气候变化研究进展, 2022, 18(2): 154-165. |
| 阅读次数 | ||||||
|
全文 |
|
|||||
|
摘要 |
|
|||||