IPCC第六次评估报告中的《图集》
Atlas in the IPCC AR6
注:(a)图中功能区可用于定义数据集、变量、时段(参考和基准)和季节,且此图为相对于1981—2010年平均,CMIP6模式预估的SSP5-8.5情景下2081—2100年平均温度变化。
IPCC第六次评估报告中的《图集》 |
| 李建, 陈昊明 |
|
Atlas in the IPCC AR6 |
| LI Jian, CHEN Hao-Ming |
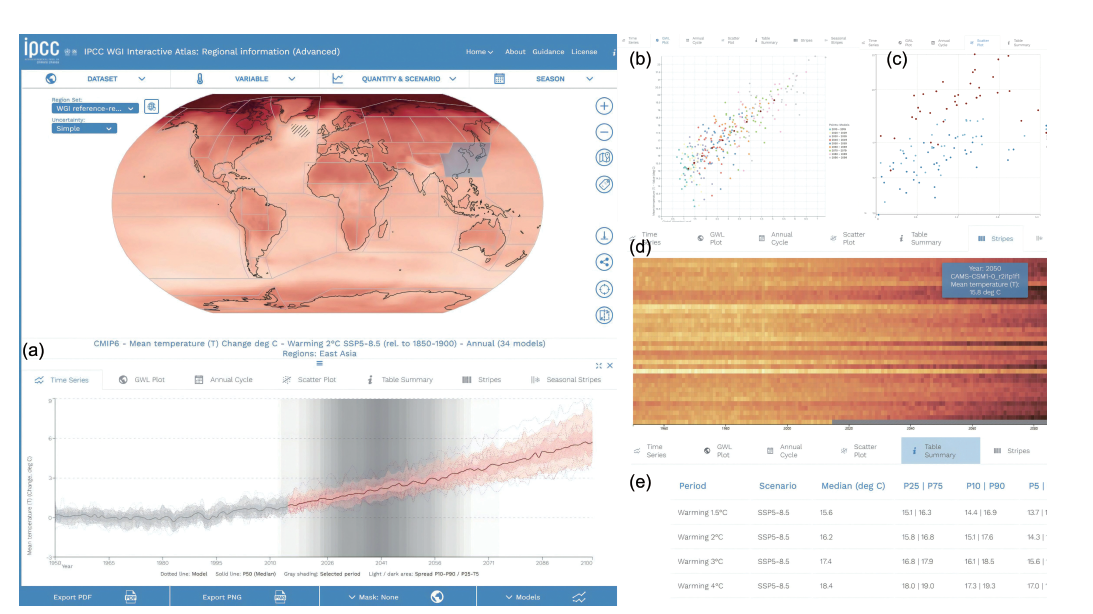
| 图2 交互图集示例。(a)主界面包括全球地图和不同功能区,(b~e)所选区域平均气候变化信息的各种视觉效果和信息汇总表 注:(a)图中功能区可用于定义数据集、变量、时段(参考和基准)和季节,且此图为相对于1981—2010年平均,CMIP6模式预估的SSP5-8.5情景下2081—2100年平均温度变化。 |
| Fig. 2 Examples of Interactive Atlas online. (a) Main interface including global map and different functional areas, (b-e) various visuals and information summary tables of average climate change information for the selected region |
|
|