气候变化研究进展 ›› 2021, Vol. 17 ›› Issue (4): 410-419.doi: 10.12006/j.issn.1673-1719.2021.026
所属专题: 减污降碳协同增效专栏
碳中和愿景下的污水处理厂温室气体排放情景模拟研究
任佳雪1,2( ), 高庆先2, 陈海涛1, 孟丹1, 张阳3, 马占云2(), 刘倩2, 唐甲洁4
- 1 首都师范大学资源环境与旅游学院,北京 100048
2 中国环境科学研究院,北京 100012
3 大连市生态环境事务服务中心,大连 116000
4 兰州中心气象台,兰州 730000
-
收稿日期:2021-02-20修回日期:2021-04-17出版日期:2021-07-30发布日期:2021-08-11 -
通讯作者:马占云 -
作者简介:任佳雪,女,硕士研究生,759708127@qq.com -
基金资助:“碳排放达峰行动”项目编码(14404200000020Z001);国家重点研发计划项目(2018YFC1507701);环境保护政策、法规、规划及标准项(144026000000190006);美国环保协会项目(2019-434)
Simulation research on greenhouse gas emissions from wastewater treatment plants under the vision of carbon neutrality
REN Jia-Xue1,2(), GAO Qing-Xian2, CHEN Hai-Tao1, MENG Dan1, ZHANG Yang3, MA Zhan-Yun2(), LIU Qian2, TANG Jia-Jie4
- 1 Department of Resource Environment and Tourism, Capital Normal University, Beijing 100048, China
2 Chinese Research Academy of Environmental Sciences, Beijing 100012, China
3 Dalian Ecological and Environmental Affairs Service Center, Dalian 116000, China
4 Lanzhou Central Meteorological Observatory, Lanzhou 730000, China
-
Received:2021-02-20Revised:2021-04-17Online:2021-07-30Published:2021-08-11 -
Contact:MA Zhan-Yun
摘要:
污水处理厂运行过程中大量释放甲烷(CH4)和氧化亚氮(N2O),是重要的人为温室气体排放源。基于2005—2015年统计资料和IPCC核算方法,估算了2005—2015年中国生活污水处理厂CH4和N2O排放,分析了其排放特征和影响因素;依据碳中和愿景设定3种减排情景(低减排、中减排和高减排),并预估了2020—2050年排放趋势和时空变化。结果表明:2005—2015年间污水处理厂温室气体排放量呈稳定增长趋势,CH4从1135.37万t CO2e上升至1501.45万t CO2e,N2O从2651.08万t CO2e上升为2787.05万t CO2e,年均增速分别为2.8%和0.5%。3种减排情景下,2020—2050年CH4和N2O排放量时间上呈先增后减趋势,低减排情景下CH4和N2O排放量分别于2036年和2025年达到峰值,分别为2431万和2819万t CO2e;中减排情景和高减排情景下CH4峰值点分别出现在2027和2025年,而N2O排放峰值均出现在2025年。2050年中减排和高减排情景下CH4排放量相较于低减排情景减排率约为47%和94%;2050年低减排、中减排和高减排情景下N2O排放量相较于2015年分别减排了12%、53%和95%。CH4和N2O排放量在空间上差异显著,华东地区排放量高,西北地区排放量低,东南区域所在省份排放量整体高于西北区域省份。影响因素中的经济发展程度与温室气体排放量密切相关。
引用本文
任佳雪, 高庆先, 陈海涛, 孟丹, 张阳, 马占云, 刘倩, 唐甲洁. 碳中和愿景下的污水处理厂温室气体排放情景模拟研究[J]. 气候变化研究进展, 2021, 17(4): 410-419.
REN Jia-Xue, GAO Qing-Xian, CHEN Hai-Tao, MENG Dan, ZHANG Yang, MA Zhan-Yun, LIU Qian, TANG Jia-Jie. Simulation research on greenhouse gas emissions from wastewater treatment plants under the vision of carbon neutrality[J]. Climate Change Research, 2021, 17(4): 410-419.
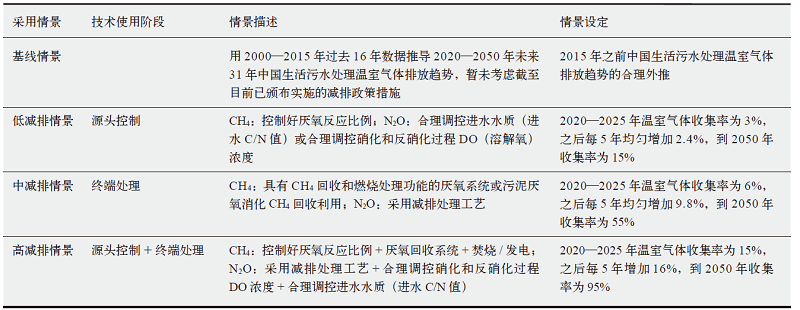 |
表1 情景描述及设定
Table 1 Emission scenario description and settings
| |
 |
表2 未来核心社会参数设定
Table 2 The assumption of future key social variables
| |
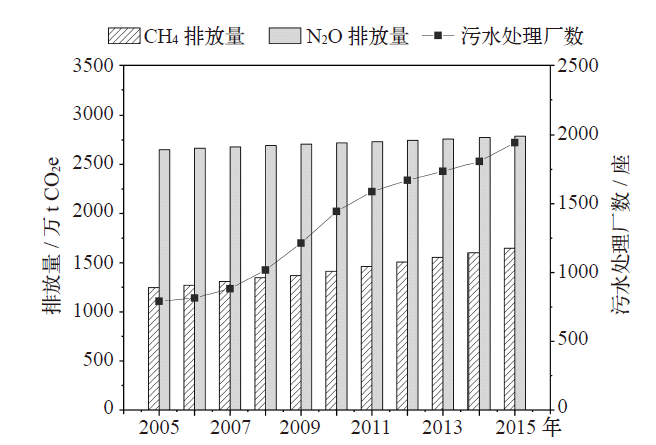
图1 2005—2015年全国温室气体排放量
Fig. 1 Greenhouse gas emissions during 2005-2015
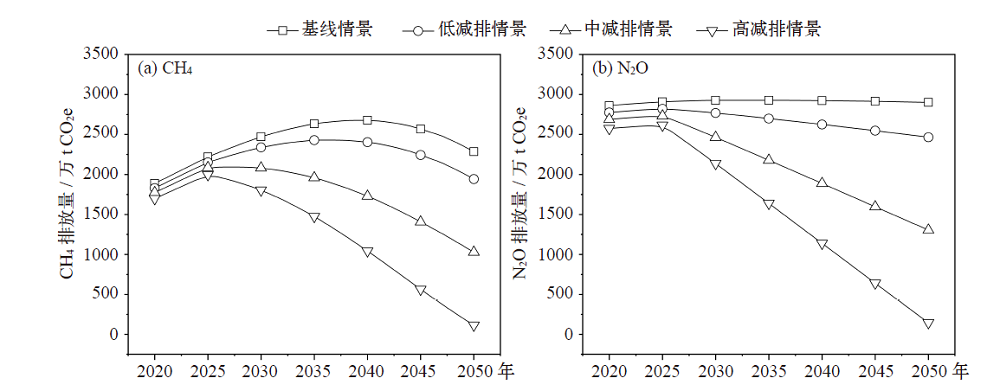
图2 温室气体2020—2050年排放模拟趋势
Fig. 2 Simulation trend of greenhouse gas emissions in 2020-2050
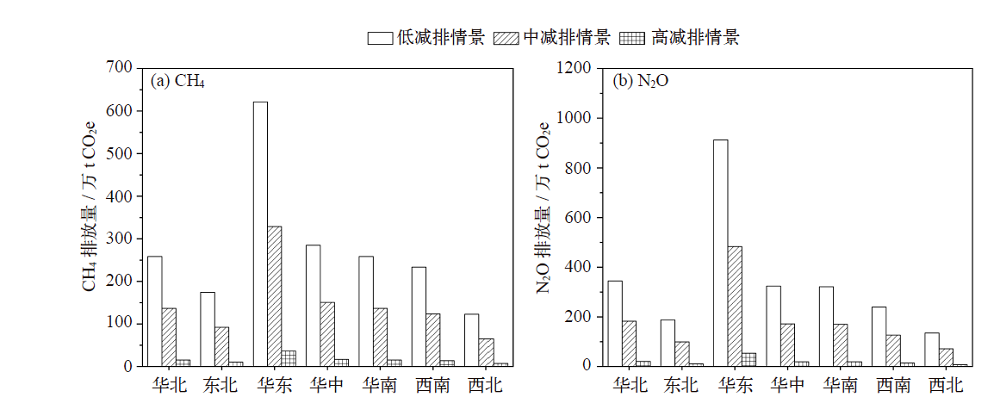
图3 2050年中国各区域不同减排情景下温室气体排放量
Fig. 3 Greenhouse gas emissions under different emission reduction scenarios in various regions in 2050
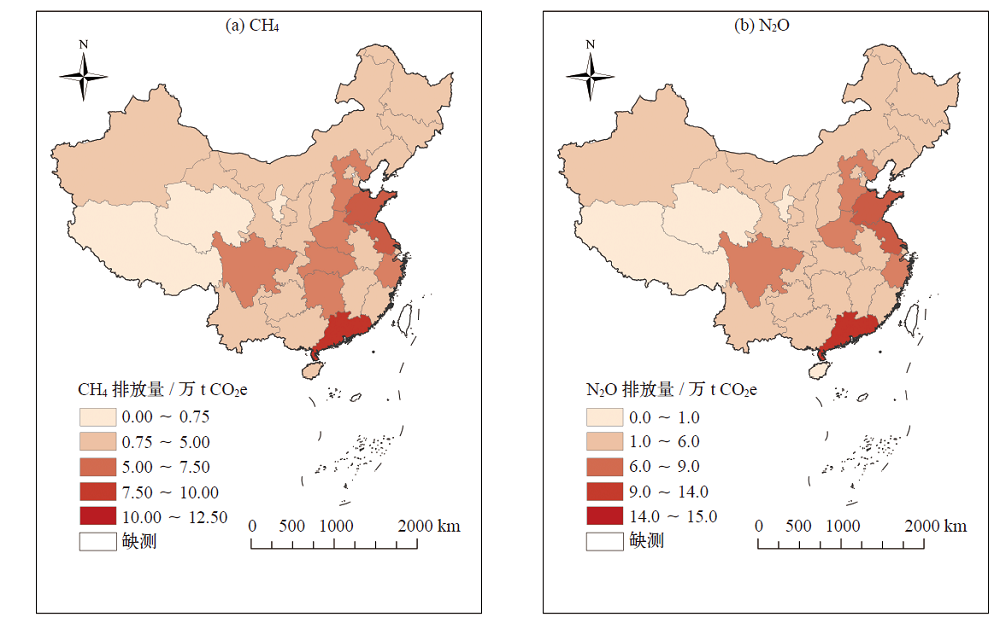
图4 2050年高减排情景下温室气体排放量空间分布
Fig. 4 Spatial distribution of greenhouse gas emissions under high emission reduction scenario in 2050
| [1] |
Mannina G, Ekama G, Caniani D, et al. Greenhouse gases from wastewater treatment: a review of modelling tools[J]. Science of The Total Environment, 2016, 551-552:254-270
doi: 10.1016/j.scitotenv.2016.01.163 URL |
| [2] |
Zickfeld K, Solomon S, Gilford D M. Centuries of thermal sea-level rise due to anthropogenic emissions of short-lived greenhouse gases[J]. Proceedings of The National Academy of Sciences, 2017, 114(4):657-662
doi: 10.1073/pnas.1612066114 URL |
| [3] | IPCC. Global warming of 1.5℃[R/OL]. 2018 [2020-10-15]. https://www.ipcc.ch/sr15/ |
| [4] | 赵宗慈, 罗勇, 黄建斌. 从CMIP5看全球1.5℃升温[J]. 气候变化研究进展, 2018, 14(2):218-220. |
| Zhao Z C, Luo Y, Huang J B. Understanding global warming of 1.5℃ from CMIP5[J]. Climate Change Research, 2018, 14(2):218-220 (in Chinese) | |
| [5] | IPCC. 2006 IPCC guidelines for national greenhouse gas inventories[M]. Kanagawa: Institute for Global Environmental Strategies, 2006 |
| [6] | 周亚敏. 非二氧化碳温室气体控制的战略与技术选择[J]. 气候变化研究进展, 2013, 9(4):295-298. |
| Zhou Y M. The strategy and technology selection for non-CO2 greenhouse gas emission control[J]. Climate Change Research, 2013, 9(4):295-298 (in Chinese) | |
| [7] |
Fang K, Tang Y, Zhang Q, et al. Will China peak its energy-related carbon emissions by 2030? lessons from 30 Chinese provinces[J]. Applied Energy, 2019, 255:113852
doi: 10.1016/j.apenergy.2019.113852 URL |
| [8] |
Larsen A. CO2-neutral wastewater treatment plants or robust, climate-friendly wastewater management? A systems perspective[J]. Water Research, 2015, 87:513-521
doi: 10.1016/j.watres.2015.06.006 pmid: 26260540 |
| [9] | IPCC. Climate change 2014: synthesis report [M]. Cambridge: Cambridge University Press, 2014: 151 |
| [10] | 谢淘, 汪诚文. 污水处理厂温室气体排放评估[J]. 清华大学学报: 自然科学版, 2012 (4):473-477. |
| Xie T, Wang C W. Assessment of greenhouse gas emissions from sewage treatment plants[J]. Journal of Tsinghua University: Science and Technology, 2012 (4):473-477 (in Chinese) | |
| [11] | 翟萌, 邵越, 徐福军. 西安污水处理厂温室气体排放及减排对策研究[J]. 水污染防治, 2016, 34(2):23-26. |
| Zhai M, Shao Y, Xu F J. Countermeasures on greenhouse gas emission reduction for the wastewater treatment plants of Xi’an[J]. Water Pollution Control, 2016, 34(2):23-26 (in Chinese) | |
| [12] |
Polruang S, Sirivithayapakorn S, Prateep N. A comparative life cycle assessment of municipal wastewater treatment plants in Thailand under variable power schemes and effluent management programs[J]. Journal of Cleaner Production, 2018, 172:635-648
doi: 10.1016/j.jclepro.2017.10.183 URL |
| [13] | 李惠娟, 彭党聪, 刘文博, 等. 不同污水处理工艺非二氧化碳温室气体的释放[J]. 环境科学, 2017, 38(4):1640-1646. |
| Li H J, Peng D C, Liu W B, et al. Non-CO2 greenhouse gas release from different biological wastewater treatment processes[J]. Environmental Science, 2017, 38(4):1640-1646 (in Chinese) | |
| [14] | 胡大龙, 王罗春, 周振. 污水处理过程中的温室气体排放现状及展望[J]. 环境科学与技术, 2014, 37(3):108-112. |
| Hu D L, Wang L C, Zhou Z. Status and prospects of greenhouse gas emissions in wastewater treatment[J]. Environmental Science and Technology, 2014, 37(3):108-112 (in Chinese) | |
| [15] | 郭莉娜, 王伯铎, 贺亮. 城镇污水处理厂低碳运行机制研究[J]. 生态环境, 2012 (1):404-408. |
| Guo L N, Wang B D, He L. Research on the low-carbon operational mechanism of urban sewage treatment plants[J]. Ecological Environment, 2012 (1):404-408 (in Chinese) | |
| [16] |
Sweetapple C, Fu G, Butler D. Multi-objective optimization of wastewater treatment plant control to reduce greenhouse gas emissions[J]. Water Research, 2014, 55:52-62
doi: 10.1016/j.watres.2014.02.018 pmid: 24602860 |
| [17] |
Kampschreur M J, Temmink H, Kleerebezem R, et al. Nitrous oxide emission during wastewater treatment[J]. Water Research, 2009, 43(17):4093-4103
doi: 10.1016/j.watres.2009.03.001 pmid: 19666183 |
| [18] |
Aboobakar A, Cartmell E, Stephenson T, et al. Nitrous oxide emissions and dissolved oxygen profiling in a full-scale nitrifying activated sludge treatment plant[J]. Water Research, 2013, 47(2):524-534
doi: 10.1016/j.watres.2012.10.004 pmid: 23159006 |
| [19] | Daelman M R, van Voorthuizen E M, van Dongen L, et al. Methane and nitrous oxide emissions from municipal wastewater treatment: results from a long-term study[J]. Water Science & Technology, 2013, 67(10):235-244 |
| [20] | Mamais D, Noutsopoulos C, Dimopoulou A, et al. Wastewater treatment process impact on energy savings and greenhouse gas emissions[J]. Water Science & Technology, 2015, 71(2):303-308 |
| [21] | 张星. 城镇生活污水处理系统碳排放研究[D]. 南京: 南京信息工程大学, 2018: 1-3. |
| Zhang X. Study on carbon emission of urban domestic wastewater treatment system[D]. Nanjing: Nanjing University of Information Technology, 2018: 1-3 (in Chinese) | |
| [22] | Shrestha S, Anal A K, Salam P A, et al. Effect of climate change in wastewater treatment plants: reviewing the problems and solutions[J]. Springer Water, 2015, 10:197-220 |
| [23] |
Zhang Q, Nakatani J, Wang T, et al. Hidden greenhouse gas emissions for water utilities in China’s cities[J]. Journal of Cleaner Production, 2017, 162:665-677
doi: 10.1016/j.jclepro.2017.06.042 URL |
| [24] | 周兴, 郑有飞, 吴荣军, 等. 2003—2009年中国污水处理部门温室气体排放研究[J]. 气候变化研究进展, 2012, 8(2):131-136. |
| Zhou X, Zheng Y F, Wu R J, et al. Greenhouse gas emissions from wastewater treatment in China during 2003-2009[J]. Climate Change Research, 2012, 8(2):131-136 (in Chinese) | |
| [25] | 闫旭, 邱德志, 郭东丽, 等. 中国城镇污水处理厂温室气体排放时空分布特征[J]. 环境科学, 2018, 39(3):1256-1263. |
| Yan X, Qiu D Z, Guo D L, et al. Emission inventory of greenhouse gas from urban wastewater treatment plants and its temporal and spatial distribution in China[J]. Environmental Science, 2018, 39(3):1256-1263 (in Chinese) | |
| [26] |
Nguyen T K L, Ngo H H, Guo W. Insight into greenhouse gases emissions from the two popular treatment technologies in municipal wastewater treatment processes[J]. Science of The Total Environment, 2019, 671:1302-1313
doi: 10.1016/j.scitotenv.2019.03.386 |
| [27] | 马占云, 冯鹏, 高庆先, 等. 中国废水处理甲烷排放特征和减排潜力分析[J]. 气候变化研究进展, 2015 (5):47-56. |
| Ma Z Y, Feng P, Gao Q X, et al. CH4 emissions and reduction potential in wastewater treatment of China[J]. Climate Change Research, 2015 (5):47-56 (in Chinese) | |
| [28] |
Nayeb H, Mirabi M, Motiee H, et al. Estimating greenhouse gas emissions from Iran’s domestic wastewater sector and modeling the emission scenarios by 2030[J]. Journal of Cleaner Production, 2019, 236:117673
doi: 10.1016/j.jclepro.2019.117673 URL |
| [29] | 宋丽丽, 罗勇, 高庆先, 等. 生活污水中BOD_5与COD_(Cr)关系的区域性差异分析[J]. 环境科学研究, 2011 (10):76-82. |
| Song L L, Luo Y, Gao Q X, et al. Analysis of regional differences in the relationship between BOD_5 and COD_(Cr) in domestic sewage[J]. Research of Environmental Sciences, 2011 (10):76-82 (in Chinese) | |
| [30] | 蔡博峰, 高庆先, 李中华. 中国污水处理厂甲烷排放研究[J]. 中国环境科学, 2015, 35(12):3810-3816. |
| Cai B F, Gao Q X, Li Z H. Estimation of methane emissions of wastewater treatment plants in China[J]. China Environmental Science, 2015, 35(12):3810-3816 (in Chinese) | |
| [31] | 国家统计局. 中国城市建设统计年鉴[M]. 北京: 中国统计出版社, 2005—2015. |
| National Bureau of Statistics of China. China city statistical yearbook [M]. Beijing: China Statistics Press, 2005-2015 (in Chinese) | |
| [32] | 国家统计局. 中国统计年鉴 [M]. 北京: 中国统计出版社, 2005—2015. |
| National Bureau of Statistics of China. China statistical yearbook [M]. Beijing: China Statistics Press, 2005-2015 (in Chinese) | |
| [33] | 中华人民共和国生态环境部. 中国环境统计年报[M]. 北京: 中国环境科学出版社, 2005—2015. |
| Ministry of Ecology and Environment of the People’s Republic of China. China environmental statistics annual report [M]. Beijing: China Environmental Science Press, 2005-2015 (in Chinese) | |
| [34] | Food and Agriculture Organization of the United Nations. FAOSTAT: FAO statistical databases [EB/OL]. 2015 [2021-02-20]. http://faostat3.fao.org/download/FB/FBS/E |
| [35] | 国家发展和改革委员会应对气候变化司. 省级温室气体清单编制指南[R/OL]. 2011 [2021-02-20]. http://www.ncsc.org.cn/. |
| Department of Climate Change, National Development and Reform Commission. Guidelines for the preparation of provincial greenhouse gas inventories [R/OL]. 2011 [2021-02-20]. http://www.ncsc.org.cn/(in Chinese) | |
| [36] | 于洋, 崔胜辉, 林建艺. 城市废弃物处理温室气体排放研究: 以厦门市为例[J]. 环境科学, 2012, 33(9):3288-3294. |
| Yu Y, Cui S H, Lin J Y. Study on greenhouse gas emissions from urban waste disposal system: a case study in Xiamen[J]. Environmental Science, 2012, 33(9):3288-3294 (in Chinese) | |
| [37] | 刘伟, 蔡志洲. 我国工业化进程中产业结构升级与新常态下的经济增长[J]. 北京大学学报: 哲学社会科学版, 2015, 52:5-19. |
| Liu W, Cai Z Z. The upgradation of industrial structure in the process of China’s industrialization and its economic growth under the new normal[J]. Journal of Peking University: Philosophy and Social Sciences, 2015, 52:5-19 (in Chinese) | |
| [38] | 韩永辉, 黄亮雄, 邹建华. 中国经济结构性减速时代的来临[J]. 统计研究, 2016, 33:23-33. |
| Han Y H, Huang L X, Zou J H. The advent of the era of China’s economic structural slowdown[J]. Statistical Research, 2016, 33:23-33 (in Chinese) | |
| [39] | 国务院. 国务院关于印发国家人口发展规划(2016—2030年)[EB/OL]. 2016 [2021-02-20]. http://www.gov.cn/. |
| State Council. The State Council on issuing the national population development plan (2016-2030) [EB/OL]. 2016 [2021-02-20]. http://www.gov.cn/(in Chinese) | |
| [40] | 顾朝林, 管卫华, 刘合林. 中国城镇化2050: SD模型与过程模拟[J]. 中国科学: 地球科学, 2017, 47(7):818-832. |
| Gu C L, Guan W H, Liu H L. Chinese urbanization 2050: SD modeling and process simulation[J]. Science China: Earth Sciences, 2017, 47(7):818-832 (in Chinese) | |
| [41] | 岳珍, 赖茂生. 国外情景分析方法的进展[J]. 情报杂志, 2006 (7):59-60. |
| Yue Z, Lai M S. Research progress abroad on scenario analysis[J]. Journal of Information, 2006 (7):59-60 (in Chinese) | |
| [42] | 张军, 夏训峰, 贾春蓉, 等. 中国城镇生活废水排放量影响因素及情景分析[J]. 资源开发与市场, 2009, 25(5):397-399. |
| Zhang J, Xia X F, Jia C R, et al. Analysis of scenario and factors on China’s urban wastewater emission[J]. Resource Development and Market, 2009, 25(5):397-399 (in Chinese) | |
| [43] | 黄洵, 黄民生, 黄飞萍. 福建省温室气体排放影响因素分析[J]. 热带地理, 2013, 33(6):674-680. |
| Huang X, Huang M S, Huang F P. Influencing factors analysis of greenhouse gas emissions in Fujian province[J]. Tropical Geography, 2013, 33(6):674-680 (in Chinese) | |
| [44] | 国家环境保护总局. 城镇污水处理厂污染物排放标准: GB-18918—2002 [S/OL]. 2002 [2021-02-20]. http://www.mee.gov.cn/. |
| State Environmental Protection Administration. Discharge standard of pollutants for municipal wastewater treatment plant: GB-18918—2002 [S/OL]. 2002 [2021-02-20]. http://www.mee.gov.cn/(in Chinese) | |
| [45] | 陈晓光, 徐晋涛, 季永杰. 华北地区城市居民用水需求影响因素分析[J]. 自然资源学报, 2007, 22(2):275-280. |
| Chen X G, Xu J T, Ji Y J. Residential water demand analysis in North China[J]. Journal of Natural Resources, 2007, 22(2):275-280 (in Chinese) | |
| [46] | 董婕, 张华丽, 延军平. 西安城市化进程对城市用水的影响[J]. 资源科学, 2010, 32(8):1520-1526. |
| Dong J, Zhang H L, Yan J P. The influence of urbanization on urban water consumption in Xi’ an city[J]. Resources Science, 2010, 32(8):1520-1526 (in Chinese) | |
| [47] |
Stoker P, Rothfeder R. Drivers of urban water use[J]. Sustainable Cities and Society, 2014, 12:1-8
doi: 10.1016/j.scs.2014.03.002 URL |
| [1] | 李丹阳, 陈文颖. 碳中和目标下全球交通能源转型路径[J]. 气候变化研究进展, 2023, 19(2): 203-212. |
| [2] | 杨姗姗, 郭豪, 杨秀, 李政. 双碳目标下建立碳排放总量控制制度的思考与展望[J]. 气候变化研究进展, 2023, 19(2): 191-202. |
| [3] | 米志付, 张浩然. IPCC AR6 WGIII报告解读:城市系统减缓气候变化[J]. 气候变化研究进展, 2023, 19(2): 139-150. |
| [4] | 樊星, 李路, 秦圆圆, 高翔. 主要发达经济体从碳达峰到碳中和的路径及启示[J]. 气候变化研究进展, 2023, 19(1): 102-115. |
| [5] | 李品, 谢晓敏, 黄震. 德国能源转型进程及对中国的启示[J]. 气候变化研究进展, 2023, 19(1): 116-126. |
| [6] | 李晓易, 吴睿. 交通运输温室气体核算边界和测算方法研究[J]. 气候变化研究进展, 2023, 19(1): 84-90. |
| [7] | 郭偲悦, 耿涌. IPCC AR6报告解读:工业部门减排[J]. 气候变化研究进展, 2022, 18(5): 574-579. |
| [8] | 白泉, 胡姗, 谷立静. 对IPCC AR6报告建筑章节的介绍和解读[J]. 气候变化研究进展, 2022, 18(5): 557-566. |
| [9] | 高园, 欧训民. IPCC AR6报告解读:强化技术和管理创新的交通运输部门减碳路径[J]. 气候变化研究进展, 2022, 18(5): 567-573. |
| [10] | 闫书琪, 李素梅, 吕鹤, 陈莎, 刘影影, 王宏涛, 刘会政, 陈前利. 基于混合LCA的新疆地区电力生产水足迹分析及碳中和目标下的变化[J]. 气候变化研究进展, 2022, 18(3): 294-304. |
| [11] | 曾桉, 谭显春, 王毅, 高瑾昕. 国际气候投融资监测、报告与核证制度及启示[J]. 气候变化研究进展, 2022, 18(2): 215-229. |
| [12] | 张浩楠, 申融容, 张兴平, 康俊杰, 袁家海. 中国碳中和目标内涵与实现路径综述[J]. 气候变化研究进展, 2022, 18(2): 240-252. |
| [13] | 刘海燕, 郑爽. 温室气体排放信息披露经验借鉴与政策建议[J]. 气候变化研究进展, 2021, 17(5): 570-578. |
| [14] | 毛显强, 曾桉, 邢有凯, 高玉冰, 何峰. 从理念到行动:温室气体与局地污染物减排的协同效益与协同控制研究综述[J]. 气候变化研究进展, 2021, 17(3): 255-267. |
| [15] | 高庆先, 高文欧, 马占云, 唐甲洁, 付加锋, 李迎新, 任佳雪. 大气污染物与温室气体减排协同效应评估方法及应用[J]. 气候变化研究进展, 2021, 17(3): 268-278. |
| 阅读次数 | ||||||
|
全文 |
|
|||||
|
摘要 |
|
|||||