气候变化研究进展 ›› 2022, Vol. 18 ›› Issue (1): 58-69.doi: 10.12006/j.issn.1673-1719.2021.009
基于UTCI指数的1980—2019年中国夏季人体舒适度变化特征分析
林卉娇1,2, 马红云1,2( ), 张弥3
- 1 南京信息工程大学气象灾害预报预警与评估协同创新中心/气象灾害教育部重点实验室,南京 210044
2 南京信息工程大学,南京 210044
3 南京大学,南京 210023
-
收稿日期:2021-01-14修回日期:2021-05-06出版日期:2022-01-30发布日期:2021-10-26 -
通讯作者:马红云 -
作者简介:林卉娇,女,硕士研究生 -
基金资助:国家重点研发计划项目(2017YFA0603804)
Analysis of the variation characteristics of human thermal comfort in summer of China from 1980 to 2019 based on UTCI
LIN Hui-Jiao1,2, MA Hong-Yun1,2(), ZHANG Mi3
- 1 Collaborative Innovation Center on Forecast and Evaluation of Meteorological Disasters (CIC-FEMD) / Key Laboratory of Meteorological Disaster, Ministry of Education (KLME), Nanjing University of Information Science and Technology (NUIST), Nanjing 210044, China
2 Nanjing University of Information Science and Technology (NUIST), Nanjing 210044, China
3 Nanjing University, Nanjing 210023, China
-
Received:2021-01-14Revised:2021-05-06Online:2022-01-30Published:2021-10-26 -
Contact:MA Hong-Yun
摘要:
基于ERA5-HEAT再分析资料中的通用热气候指数(UTCI)数据,利用旋转经验正交函数(REOF)方法将我国划分为8个区,分别为长江、华南、华北、西北、东北、北疆、南疆和西部地区。分析了1980—2019年我国夏季不同地区人体舒适度的变化特征,并初步解释了UTCI变化的原因。主要结论如下:我国夏季UTCI呈不断增加趋势,其中西北地区增速最快(平均增率为0.053℃/a),且西部、西北和南疆地区夜间UTCI相较白天增加更明显,主要表现为这些地区的UTCI最小值增率分别较其最大值增率偏高了112%、34%和33%。随着UTCI的上升,我国大部分地区(西部除外)的热不舒适天数及发生热不舒适持续事件的频次都呈增加趋势,其中增率最大的区域是华北地区,分别为1.7 d/(10 a)和2.4次/(10 a)。从气候影响因子的分析发现,我国夏季UTCI增加的原因是气温、露点温度和平均辐射温度的增加以及风速的减少。其中,气温是UTCI增加的主要气候因子,平均贡献率为49%;辐射是大部分地区(西部和华南除外)的第二大因子,而其他因子对UTCI的贡献率主要与各地区的变率大小有关。
引用本文
林卉娇, 马红云, 张弥. 基于UTCI指数的1980—2019年中国夏季人体舒适度变化特征分析[J]. 气候变化研究进展, 2022, 18(1): 58-69.
LIN Hui-Jiao, MA Hong-Yun, ZHANG Mi. Analysis of the variation characteristics of human thermal comfort in summer of China from 1980 to 2019 based on UTCI[J]. Climate Change Research, 2022, 18(1): 58-69.
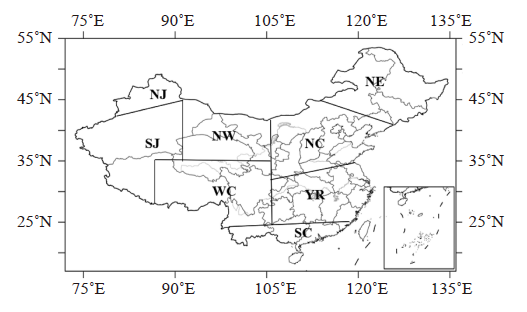
图1 1980—2019年夏季日平均UTCI标准化的REOF区域划分结果
Fig. 1 The regional division results based on REOF by the daily average and standardized UTCI of the summer from 1980 to 2019
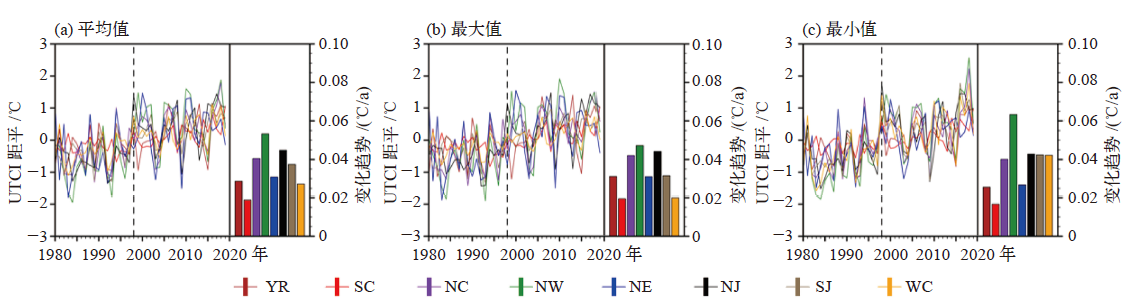
图2 1980—2019年各地区UTCI平均值(a)、最大值(b)、最小值(c)距平的年际变化及变化趋势 注:变化趋势均通过0.01的显著性水平检验。
Fig. 2 The annual variation and its trend of the anomalies of average (a), maximum (b), and minimum (c) UTCI in each region. (All of the variation trends have passed 0.01 significant level test)

图3 夏季各地区不同UTCI舒适度等级的平均天数
Fig. 3 The average days in summer of different UTCI thermal comfort levels in each region
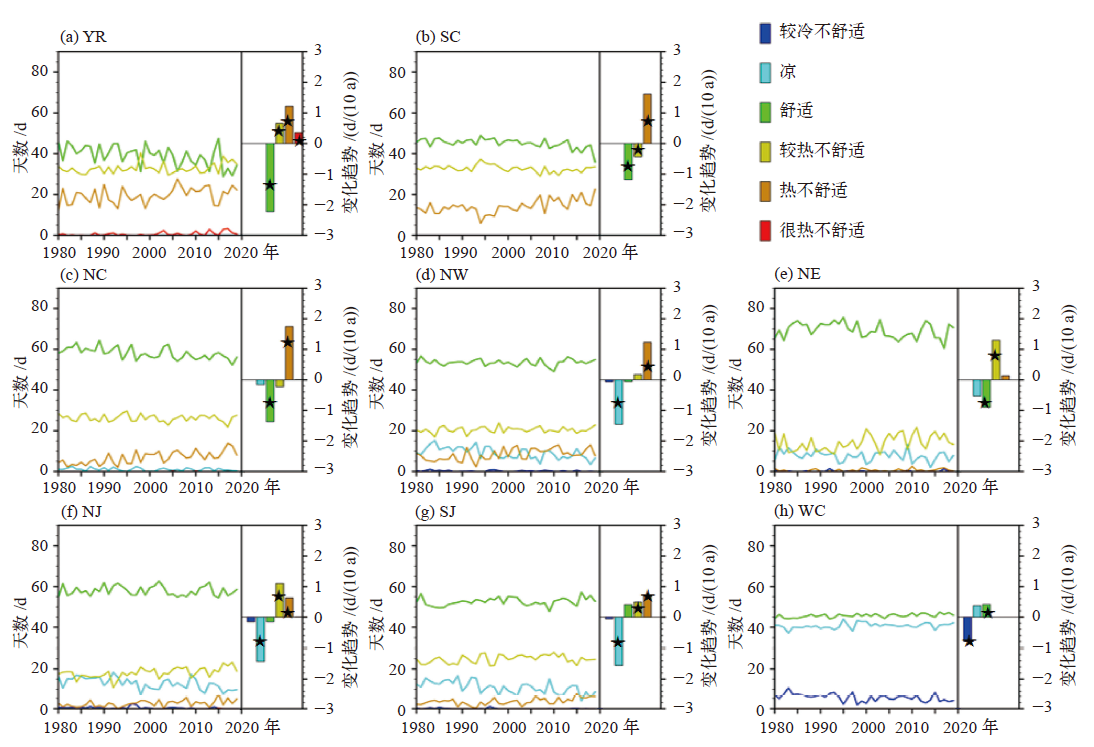
图4 1980—2019年各地区不同UTCI舒适度等级的天数年际变化及其趋势 注: ★表示通过0.10的显著性水平检验。
Fig. 4 The annual variation of days and its trend under different UTCI thermal comfort levels in each region during 1980-2019
 |
表1 1980—2019年各地区热不舒适持续3 d及以上的平均年频次及年代际变化趋势
Table 1 The average annual frequency of thermal discomfort (UTCI≥32℃) lasting for three days or more and the inter-decadal trend in each region during 1980-2019
| |

图5 1980—2019年各区域的气温(a)、露点温度(b)、风速(c)和平均辐射温度(d)的变化趋势 注: ★表示通过0.01的显著性水平检验。
Fig. 5 The variation trend of air temperature (a), dew point temperature (b), wind speed (c) and mean radiation temperature (d) in each region during 1980-2019 ( represents the tendency has passed 0.01 significant level test )
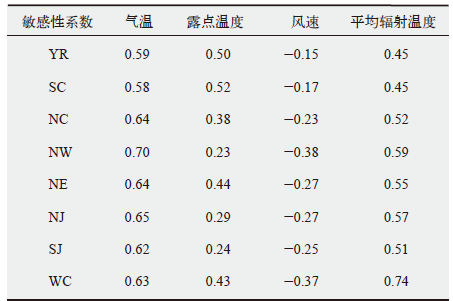 |
表2 夏季各地区的UTCI对气候因子的敏感性系数
Table 2 Sensitivity coefficient of climate factors to UTCI in summer of each region
| |
 |
表3 气候因子对各地区夏季UTCI的贡献率
Table 3 Contribution rate of climate factors to UTCI change in summer of each region %
| |
| [1] | 沈永平, 王国亚. IPCC第一工作组第五次评估报告对全球气候变化认知的最新科学要[J]. 冰川冻土, 2013, 35(5): 1068-1076. |
| Shen Y P, Wang G Y. Key findings and assessment results of IPCC WGI fifth assessment report[J]. Journal of Glaciology and Geocryology, 2013, 35(5): 1068-1076 (in Chinese) | |
| [2] |
Meehl G A, Tebaldi C. More intense, more frequent, and longer lasting heat waves in the 21st century[J]. Science, 2004, 305(5686): 994-997
doi: 10.1126/science.1098704 URL |
| [3] |
Napoli C D, Barnard C, Prudhomme C, et al. ERA5-HEAT: a global gridded historical dataset of human thermal comfort indices from climate reanalysis[J]. Geoscience Data Journal, 2020, 8(1): 1-9
doi: 10.1002/gdj3.v8.1 URL |
| [4] |
Kjellstro T, Freyberg C, Lemke B, et al. Estimating population heat exposure and impacts on working people in conjunction with climate change[J]. International Journal of Biometeorology, 2018, 62(3): 291-306
doi: 10.1007/s00484-017-1407-0 URL |
| [5] | 吴凡, 景元书, 李雪源, 等. 南京地区高温热浪对心脑血管疾病日死亡人数的影响[J]. 环境卫生学杂志, 2013, 3(4): 288-292. |
| Wu F, Jing Y S, Li X Y, et al. Effect of heat wave on the death-toll of cardiovascular diseases in Nanjing area[J]. Journal of Environmental Hygiene Aug, 2013, 3(4): 288-292 (in Chinese) | |
| [6] | Cai W J, Zhang C, Suen H P, et al. The 2020 China report of the Lancet countdown on health and climate change[J]. The Lancet Public Health, 2020, 6(1): 64-81 |
| [7] | Coccolo S, Jérôme K, Scartezzini J L, et al. Outdoor human comfort and thermal stress: a comprehensive review on models and standards[J]. Urban Climate, 2016 (18): 33-57 |
| [8] |
Potchter O, Cohen P, Lin T P, et al. Outdoor human thermal perception in various climates: a comprehensive review of approaches, methods and quantification [J]. Science of The Total Environment, 2018, 631-632(AUG.1): 390-406
doi: 10.1016/j.scitotenv.2018.02.276 URL |
| [9] |
Jendritzky G, de D R, Havenith G. UTCI: why another thermal index?[J]. International Journal of Biometeorology, 2012, 56(3): 421-428
doi: 10.1007/s00484-011-0513-7 pmid: 22187087 |
| [10] | Houghten F C, Yagloglou C P. Determining lines of equal comfort[J]. ASHVE Transactions, 1923, 29(10): 163-176 |
| [11] | Yaglou C P, Minard D. Control of heat casualties at military training centers[J]. AMA Archives of Industrial Health, 1957, 16(4): 302-316 |
| [12] | Thom E C. A new concept of cooling degree days[J]. Air Condit Heat Ventil, 1957, 54(6): 73-80 |
| [13] | Thom E C. The discomfort index[J]. Weatheenvise, 1959 (12): 57-60 |
| [14] | Siple P, Passel C. Measurements of dry atmospheric cooling in subfreezing temperatures[J]. Proceedings of The American Philosophical Society, 1945, 89(1): 177-199 |
| [15] | 闫业超, 岳书平, 刘学华, 等. 国内外气候舒适度评价研究进展[J]. 地球科学进展, 2013, 28(10): 1119-1125. |
| Yan Y C, Yue S P, Liu X H, et al. Advances in assessment of bioclimatic comfort conditions at home and abroad[J]. Advances in Earth Science, 2013, 28(10): 1119-1125 (in Chinese) | |
| [16] | Gagge A P, Fobelets A P, Berglund L G. A standard predictive index of human response to the thermal environment[J]. ASHRAE Transactions, 1986, 92:709-731 |
| [17] |
Höppe P. The physiological equivalent temperature: a universal index for the biometeorological assessment of the thermal environment[J]. International Journal of Biometeorology, 1999, 43(2): 71-75
pmid: 10552310 |
| [18] |
Gonzalez R R, Nishi Y, Gagge A P. Experimental evaluation of standard effective temperature a new biometeorological index of man’s thermal discomfort[J]. International Journal of Biometeorology, 1974, 18(1): 1-15
pmid: 4845140 |
| [19] |
Blazejczyk K, Epstein Y, Jendritzky G, et al. Comparison of UTCI to selected thermal indices[J]. International Journal of Biometeorology, 2012, 56(3): 515-535
doi: 10.1007/s00484-011-0453-2 pmid: 21614619 |
| [20] | Lai D, Guo D, Hou Y, et al. Studies of outdoor thermal comfort in northern China[J]. Building & Environment, 2014, 77:110-118 |
| [21] |
Napoli C D, Pappenberger F, Cloke H L. Verification of heat stress thresholds for a health-based heat-wave definition[J]. Journal of Applied Meteorology and Climatology, 2019, 58(6): 1177-1194
doi: 10.1175/JAMC-D-18-0246.1 URL |
| [22] |
Pappenberger F, Jendritzky G, Staiger H, et al. Global forecasting of thermal health hazards: the skill of probabilistic predictions of the Universal Thermal Climate Index (UTCI)[J]. International Journal of Biometeorology, 2015, 59(3): 311-323
doi: 10.1007/s00484-014-0843-3 pmid: 24859883 |
| [23] |
Bröde P, Blazejczyk K, Fiala D, et al. The universal thermal climate index UTCI compared to ergonomics standards for assessing the thermal environment[J]. Industrial Health, 2013, 51(1): 16-24
doi: 10.2486/indhealth.2012-0098 URL |
| [24] |
Psikuta A, Fiala D, Laschewski G, et al. Validation of the Fiala multi-node thermophysiological model for UTCI application[J]. International Journal of Biometeorology, 2012, 56(3): 443-460
doi: 10.1007/s00484-011-0450-5 pmid: 21656016 |
| [25] |
Ge Q S, Kong Q Q, Xi J C, et al. Application of UTCI in China from tourism perspective[J]. Theoretical and Applied Climatology, 2016, 128(3): 551-561
doi: 10.1007/s00704-016-1731-z URL |
| [26] |
Nassiri P, Monazzam M R, Golbab Ae I F, et al. Application of Universal Thermal Climate Index (UTCI) for assessment of occupational heat stress in open-pit mines[J]. Industrial Health, 2017, 55(5): 437-443
doi: 10.2486/indhealth.2017-0018 pmid: 28804096 |
| [27] |
Honjo T, Seo Y, Yamasaki Y, et al. Thermal comfort along the marathon course of the 2020 Tokyo Olympics[J]. International Journal of Biometeorology, 2018, 62(8): 1407-1419
doi: 10.1007/s00484-018-1539-x URL |
| [28] |
Zeng D, Wu J, Mu Y, et al. Spatial-temporal pattern changes of UTCI in the China-Pakistan economic corridor in recent 40 years[J]. Atmosphere, 2020, 11(8): 858
doi: 10.3390/atmos11080858 URL |
| [29] |
Napoli C D, Pappenberger F, Cloke H L. Assessing heat-related health risk in Europe via the Universal Thermal Climate Index (UTCI)[J]. International Journal of Biometeorology, 2018, 62(7): 1155-1165
doi: 10.1007/s00484-018-1518-2 URL |
| [30] | 周文娟, 申双和. 热气候指数评价1981—2014年南京夏季舒适度[J]. 科学技术与工程, 2017, 17(4): 132-136. |
| Zhou W J, Shen S H. Assessment on summer comfort level of Nanjing during 1981-2014 by UTCI[J]. Science Technology and Engineering, 2017, 17(4): 132-136 (in Chinese) | |
| [31] | 唐进时, 申双和, 华荣强, 等. 热气候指数评价中国南方城市夏季舒适度[J]. 气象科学, 2015, 35(6): 769-774. |
| Tang J S, Shen S H, Hua R Q, et al. Assessment on summer comfort level of southern cities in China by UTCI[J]. Journal of Meteorological Sciences, 2015, 35(6): 769-774 (in Chinese) | |
| [32] |
孔钦钦, 葛全胜, 席建超, 等. 中国重点旅游城市气候舒适度及其变化趋势[J]. 地理研究, 2015, 34(12): 2238-2246.
doi: 10.11821/dlyj201512003 |
| Kong Q Q, Ge Q S, Xi J C, et al. Thermal comfort and its trend in key tourism cities of China[J]. Geographic Research, 2015, 34(12): 2238-2246 (in Chinese) | |
| [33] | Wang C G, Zhan W F, Liu Z H, et al. Satellite-based mapping of the Universal Thermal Climate Index over the Yangtze River delta urban agglomeration[J]. Journal of Cleaner Production, 2020, 277:1-14 |
| [34] | 孔钦钦, 郑景云, 王新歌. 1979—2014年中国气候舒适度空间格局及时空变化[J]. 资源科学, 2016, 38(6): 1129-1139. |
| Kong Q Q, Zheng J Y, Wang X G. Spatial pattern and temporal variation in thermal comfort in China from 1979 to 2014[J]. Resources Science, 2016, 38(6): 1129-1139 (in Chinese) | |
| [35] |
孔钦钦, 葛全胜, 郑景云. 中国极端通用热气候指数的时空变化[J]. 地理研究, 2017, 36(6): 1171-1182.
doi: 10.11821/dlyj201706014 |
| Kong Q Q, Ge Q S, Zheng J Y. Spatio-temporal changes in extreme UTCI indices in China[J]. Geographical Research, 2017, 36(6): 1171-1182 (in Chinese) | |
| [36] |
Wu F, Yang X, Shen Z. Regional and seasonal variations of outdoor thermal comfort in China from 1966 to 2016[J]. Science of The Total Environment, 2019, 665:1003-1016
doi: 10.1016/j.scitotenv.2019.02.190 URL |
| [37] | 李双双, 杨赛霓, 刘宪锋, 等. 1960—2014年北京户外感知温度变化特征及其敏感性分析[J]. 资源科学, 2016, 38(1): 175-184. |
| Li S S, Yang S N, Liu X F, et al. Changes in outdoor thermal sensation and sensitivity to climate factors in Beijing from 1960 to 2014[J]. Research Science, 2016, 38(1): 175-184 (in Chinese) | |
| [38] | 张曦月, 姜超, 孙建新, 等. 气候舒适度在不同海拔的时空变化特征及其影响因素[J]. 应用生态学报, 2018, 29(9): 2808-2818. |
| Zhang X Y, Jiang C, Sun J X, et al. Spatio-temporal variations and influencing factors of thermal comfort at different elevations[J]. Chinese Journal of Applied Ecology, 2018, 29(9): 2808-2818 (in Chinese) | |
| [39] |
Bröde P, Fiala D, Błażejczyk K, et al. Deriving the operational procedure for the Universal Thermal Climate Index (UTCI)[J]. International Journal of Biometeorology, 2012, 56(3): 481-494
doi: 10.1007/s00484-011-0454-1 URL |
| [40] |
Fiala D, Havenith G, Bröde P, et al. UTCI-Fiala multi-node model of human heat transfer and temperature regulation[J]. International Journal of Biometeorology, 2012, 56(3): 429-441
doi: 10.1007/s00484-011-0424-7 URL |
| [41] |
George H, Dusan F, Krzysztof B, et al. The UTCI-clothing model[J]. International Journal of Biometeorology, 2011, 56(3): 461-470
doi: 10.1007/s00484-011-0451-4 URL |
| [42] | Kántor N, Unger J. The most problematic variable in the course of human-biometeorological comfort assessment: the mean radiant temperature[J]. Central European Journal of Geosciences, 2011, 3(1): 90-100 |
| [43] |
Napoli C D, Hogan R J, Pappenberger F. Mean radiant temperature from global-scale numerical weather prediction models[J]. International Journal of Biometeorology, 2020, 64(7): 1233-1245
doi: 10.1007/s00484-020-01900-5 URL |
| [44] | Weihs P, Staiger H, Tinz B, et al. The uncertainty of UTCI due to uncertainties in the determination of radiation fluxes derived from measured and observed meteorological data[J]. International Journal of Biometeorology: Journal of The International Society of Biometeorology, 2012, 56(3): 537-555 |
| [45] | Błażejczyk K. BioKlima-universal tool for bioclimatic and thermophysiological studies [EB/OL]. 2013 [2015-07-20]. http://www.igipz.pan.pl/Bioklima-zgik.html |
| [46] | 魏凤英. 现代气候统计诊断与预测技术 [M]. 北京: 气象出版社, 1999. |
| Wei F Y. Modern climate statistics diagnosis and prediction technology [M]. Beijing: China Meteorological Press, 1999 (in Chinese) | |
| [47] | Zheng H, Liu X, Liu C, et al. Assessing contributions to panevaporation trends in Haihe River basin, China[J]. Journal of Geophysical Research Atmospheres, 2009, 114(D24105): 1-12 |
| [48] |
Sun Y, Zhang X, Ren G, et al. Contribution of urbanization to warming in China[J]. Nature Climate Change, 2016, 6(7): 706-709
doi: 10.1038/nclimate2956 URL |
| [49] | 华文剑, 陈海山, 李兴. 中国土地利用/覆盖变化及其气候效应的研究综述[J]. 地球科学进展, 2014, 29(9): 1025-1036. |
| Hua W J, Chen H S, Li X. Review of land use and land cover change in China and associated climatic effects[J]. Advances in Earth Science, 2014, 29(9): 1025-1036 (in Chinese) | |
| [50] | 周志高, 林爱文, 王伦澈. 长江中游城市群太阳辐射长期变化特征及其与气象要素的关系研究[J]. 长江流域资源与环境, 2017 (4): 85-93. |
| Zhou Z G, Lin A W, Wang L C. Long-term variation of solar radiation and its relationship with meteorological factors in the middle reaches of Yangtze River[J]. Resources and Environment in The Yangtze Basin, 2017 (4): 85-93 (in Chinese) | |
| [51] | 黄荣辉, 顾雷, 陈际龙, 等. 东亚季风系统的时空变化及其对我国气候异常影响的最近研究进展[J]. 大气科学, 2008, 32(4): 691-719. |
| Huang R H, Gu L, Chen J L, et al. Recent progresses in studies of the temporal-spatial variations of the East Asian monsoon system and their impacts on climate anomalies in China[J]. Chinese Journal of Atmospheric Sciences, 2008, 32(4): 691-719 (in Chinese) | |
| [52] |
Chindapol S, Blair J, Osmond P, et al. A suitable thermal stress index for the elderly in summer tropical climates[J]. Procedia Engineering, 2017, 180:932-943
doi: 10.1016/j.proeng.2017.04.253 URL |
| [53] |
Lin T P, Matzarakis A. Tourism climate and thermal comfort in Sun Moon Lake, Taiwan[J]. International Journal of Biometeorology, 2008, 52(4): 281-290
doi: 10.1007/s00484-007-0122-7 URL |
| [54] |
Huang J, Zhou C, Zhuo Y, et al. Outdoor thermal environments and activities in open space: an experiment study in humid subtropical climates[J]. Building and Environment, 2016, 103:238-249
doi: 10.1016/j.buildenv.2016.03.029 URL |
| [1] | 黄鹤楼,邹旭恺,丁烨毅,陈鲜艳,石英,肖风劲. 气候变化对宁波四明山人体舒适度的影响[J]. 气候变化研究进展, 2020, 16(3): 316-324. |
| 阅读次数 | ||||||
|
全文 |
|
|||||
|
摘要 |
|
|||||